What did you learn that will help you the most and/or what most broadened your understanding of the topic? How would you now categorize your personal philosophy of performance measurement? Has it evolved with this coursework? Are there authors whose positions you find well-grounded and/or ill-founded? Why? Teams will conclude this section of the class by making a 5 – 10 minute graded summary presentation of your discussions.
We can define cost as the amount of money or resources incurred on purchase/business transactions or any other activity. The method of ascertaining cost of their products depends on and varies industry to industry depending on the nature of the production and the type of output. The cost sheet shows various components of the total cost of a product. It helps us to derive per unit cost in addition to the total cost. The cost sheet is prepared on with help of historical cost and estimated cost.
Basically there are different kinds of costs that are associated with the production or manufacturing of goods and services.
Fixed cost – A fixed cost is an expense or cost that will not change with any increase or decrease in the number of goods or services produced and sold. These expenses that have to be paid by a company whether it is operating or not i.e. even in case no production, the company will incur that cost. For example rent, salary, etc.
Variable cost – A variable cost is an expense that changes in proportion with output. Variable costs increase or decrease with the company’s production volume i.e. they will raise as production increases and falls as production decreases.
Direct cost – A direct cost is a price that can be directly attributed to the production of specific goods or services. The direct cost can be directly traced in relation to the activity. Like raw material is termed as direct raw material cost or direct labor cost.
Indirect Cost – Indirect costs are those costs that cannot be directly attributed to a cost object. These are basically of two types, fixed and variable.
There are
different methods of costing used:-
Tradition method of costing – In traditional costing the factory overhead is allocated to products based on the volume of production resources consumed. Basically, overhead is usually allocated based on either the number of direct labor hours consumed or machine hours used. This is easy to apply overhead to the goods sold.
It has its disadvantage, if a firm is producing multiple products as in the case of Wilkerson’s case, the overhead can be applied inappropriately that can actually distort the pricing of the product. The product that may need fewer resources may applied higher costs and vice versa. This severely affects the profitability and sales of the company.
Activity-Based Costing – Activity-based costing (ABC) is an accounting method that identifies and cost object and cost driver and then assigns those costs to products. An activity-based costing (ABC) we tend to recognize the relationship between costs, overhead activities, and manufactured products, and after this, it assigns indirect costs to products. In this system of costing the cost is assigned more rationally to the product as against the traditional method of costing.
It is sometimes difficult to recognize the cost driver of the cost. Indirect costs, such as management and office staff salaries, are sometimes difficult to assign to a product. This method is used mostly in the manufacturing sector.
Different steps in Activity-based costing include:
Analyze
the Activities
Gather
all the Costs
Trace
Costs to the Activities
Set up
Output Measures
Analyze
the Costs
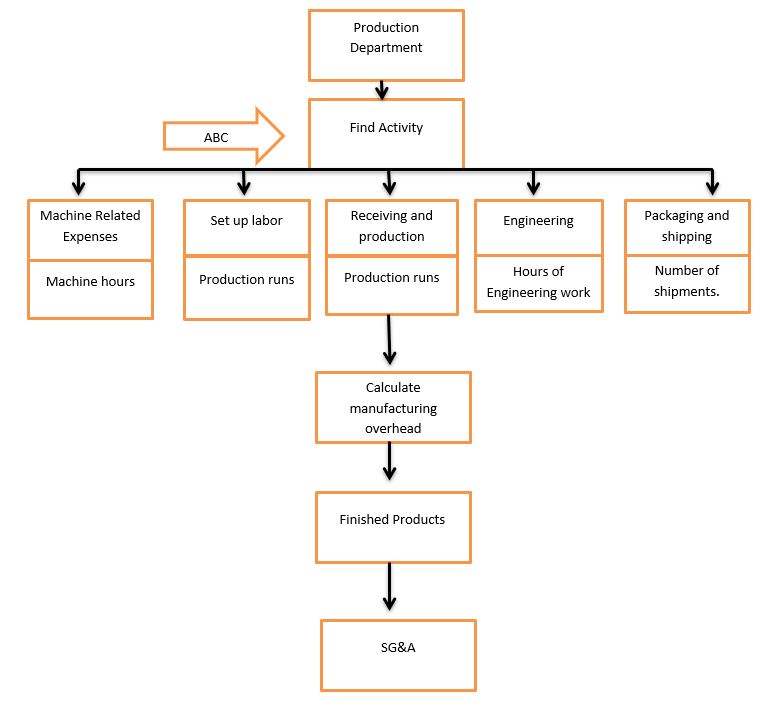
In the case of Wilkerson Company, the cost drivers are machine hour, production runs, number of shipments, and hours of engineering work. The ABC method helped the Wilkerson company to recognize the real cost attributed to its different products such as Valve, Pumps and flow controller.
Analyze the GDP growth of India in the last five financial years (2012-2017) and discuss how variation in growth had impacted your company’s business with reason and details.
Answer:
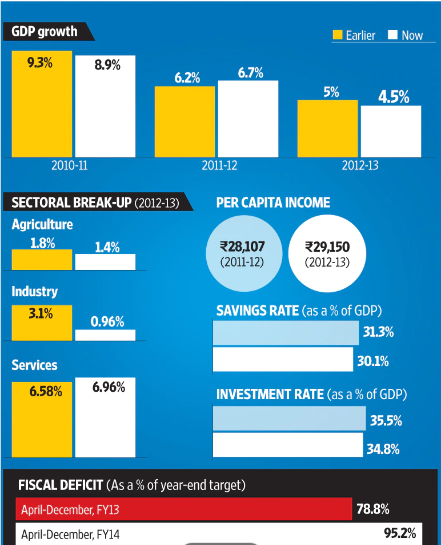
In 2011-12 fiscal year India’s economic growth was at 6.2 per. It had grown by 5.4%, 5.2%, 4.7% and 4.8% in the first, second, third and fourth quarter, respectively, of 2012-2013, according to data released by the central statistical organization. That makes it 5 percent for the entire 2012-2013 fiscal, after the revision of base year it fall to 4.5%. Major sectors affected were the manufacturing sector showing growth of 2.6% only, mining and quarrying by 3.1% farm sector output expanded by just 1.4% and farm sector also grew at a slower rate of just 1.9%.
The figure below shows the GDP for the year 2010-2013 along with the revised base year.
There are two contradictory influences operating in the economy this year. The investment was picking up, whereas consumption was decelerating. Unless investment grows at such a rate that is more than for falling consumption demand to make up for it, the net impact will be negative. The slowdown was mainly because of the laggard industry; weakness in the services sector was also evident. The Reserve Bank of India had to cut policy interest rates at all three policy reviews by 25 basis points. The absence of ease of trading in terms of securing government approval along with high borrowing cost has stalled corporate investment. At the same time, high inflation and slower hiring have shaken consumer confidence and forced households to cut spending. The decrease in the rates of savings of the household sector in physical assets from 15.8% to 14.8% and private corporate sector from 7.3% to 7.1% have attributed to a decrease in the rate of GDP in the current year compared to the previous year.
In 2013-14, smart farm sector growth contributed to India’s economy to grow 4.7 percent, according to the gross domestic product (GDP) provisional estimates which were 1.4% last year. The GDP growth rate of 4.5% in the previous was lowest in the last 10 years. This is the second back to back when the economy’s growth remained below 5 percent. The last time the economic growth rate had been below the 5-per cent mark was in 1984-85 to 1987-88.
Good harvests in both the seasons of 2013-2014 lifted farm sector growth to 4.7%. It had grown 1.4 percent in the previous fiscal. For January-March, the farm sector grew 6.3 percent against 1.6 percent growth in the same quarter of 2012-13 but because of low movement in infrastructure and high-interest rates kept investments or capital formation low.
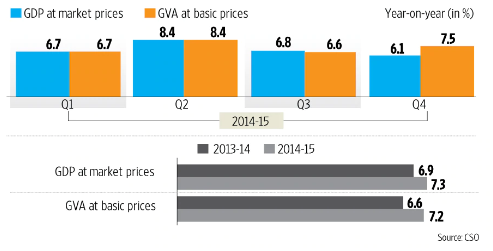
The below fissure shows GDP at market price and GVA at a basic price for the year 2014-2015
In 2014-15 the economy grew at 7.3 percent. The country outpaced China’s GDP of 7 percent in January—March quarter and posted a 7.5 percent growth in that quarter. Indian economy in 2014-2015 has emerged as one of the largest economies with strong economic outlook supported by controlled inflation, a rise in domestic demand, an increase in investment, a decline in oil prices and reforms among others.
Demand-side showing significant growth of final consumption which increased to 7.6% in 2014-2015 form 6.5% in 2013-2014, even the gross fixed capital formation increased from 3.0% in 2013-2014 to 4.1% in 2014-2015. Exports in 2014-2015 showed a growth of just 0.9% as compared to 7.3% in 2013-2014. Whereas, Imports, on the other hand, increased from -8.4% to -0.5%, due to a sharp decline in international oil prices bringing down the current year oil import bill.
Robust manufacturing growth in the year 2015-2016 makes India the fastest-growing major economy with a five-year high growth rate of 7.6 percent for the full fiscal. The farm sector also showed growth as against a contraction in the previous year, though the rate of expansion was low at 1.2 percent in 2015-16.
According to the data released by the Central Statistics Office (CSO), the growth in manufacturing and farm sectors during the January-march quarter went up to 9.3% and 2.3%, respectively. The trade, hotels, transport, and communication at 9.9%, the construction sector grew at 4.5%, financial, public administration, defense and other services at 6.4% and real estate and professional services at 9.1% in the fourth quarter of 2015-16. The manufacturing sector spurred to 9.3 percent, up from 5.5% in the last fiscal.
The growth rate of Indian Gross Domestic Product (GDP) increased from 6.6 percent in 2013-14 to 7.2 percent in 2014-15 and further to 7.6 percent in 2015-16, witnessing improvement in growth rate in the last three years. The implementation of strategic policy and systematic focus of the Government of India on economic growth and macroeconomic stability made India one of the fastest-growing major economies in the world. The Government has taken various initiatives and policy that strengthen the economy which include; reforms and liberalization of foreign direct investment in major sectors, fillip to manufacturing and infrastructure through fiscal incentives and concrete measures for transport, power, and other urban and rural infrastructure; measures to debottleneck the supply of key raw materials, etc.
The GDP grew 7.1% in the fiscal year 2016-17 because of economic growth slowed to 6.1% in the fourth quarter ending March 2017, compared with 7.1% in the previous quarter, as the government’s demonetization decision slowed activity in cash-dependent sectors.
In FY 17, the government’s final consumption expenditure was the major driver of GDP growth with an increase of over 23% as against 2.2 percent in FY 2016. The gross capital formation at GDP at constant prices, an indicator investment across the country, declined by 0.2% in FY17, continuing the downward trend since 2011. In FY 16, the export of goods and services witnessed a growth of 2,2% against y-o-y decline of 5.2% in FY15, owing to a partial recovery in commodity prices. The import witnessed a yo-y decline of 3.8% due to lower gold and other bullion imports.
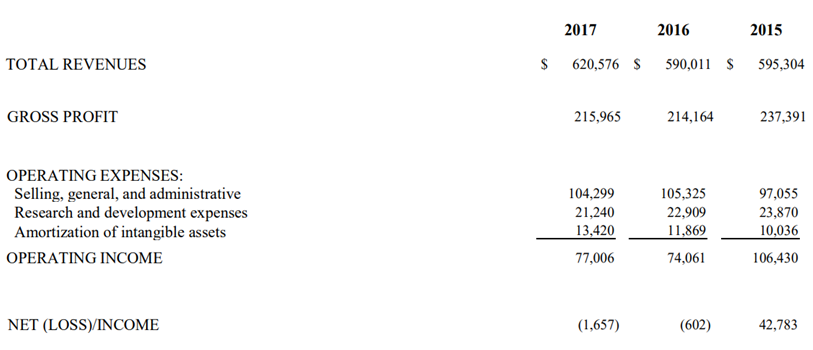
The figure below shows the last three-year excerpt from Profit and loss statement of Aricent.
The above-presented profit and loss statement of Aricent is not very rosy. Thought the top line seems to be increasing from 2016 to 2017 but the company bottom line is showing huge loss in the company books of accounts. The GDP and other economical statistic show robust growth in these years but the financial statement of Aricent is not reflecting the same.
A major part of Aricent’s revenue is still formed communication and network equipment service providers despite buying out SmartPlay, a 1200-persons chip design services outfit from Bangalore, in 2015. Aricent was an engineering services company, which was sharply focused on telecom—with its ups and downs. Moreover, growing a company with a lot of debt, then even when the business generates cash, a part of it has to be deployed to repay debt.
From the above analysis of GDP growth from 2015 to 2017 have been contributed to different factors. For instance, in 2015 the reason for higher growth is high agricultural produce rather than high growth in the manufacturing or service sector. In 2016 the major reason for the increase in growth rate was huge government spending and not the service sector. The service sector have shown moderate growth during this period and has failed to be resilient to slow down in service and exports. In 2017, there is a slowdown in growth rate which is primarily because of demonetization. The service and manufacturing sector, private investment and demand are not gearing up, though the government has come up with many policies to promote India on the international front. Government initiatives like Make in India, skill development programs are not enough to bring India to a growth trajectory.
Question:
To
what extent India’s GDP growth in alignment with the top line and bottom line
of your company?
Answer:
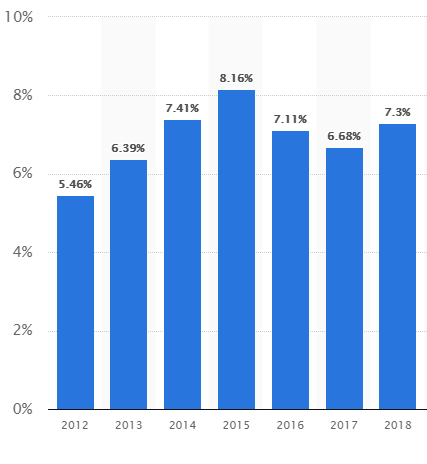
The figure below shows the GDP of India from 2012 to the 2018 fiscal year.
The GDP growth rate has a negative trajectory from the last 3 years and on positive lines from 2012 to 2015. Aricent top-line sales show the increase in growth but this growth is not reflected in the company bottom line as it is falling y-o-y as even went into the loss for the last 2 years. Aricent is a non-listed company and its major competitors like HCL, TCS, CSR, and Wipro all are listed and give hard competition to the company. In the time of weak demand and a highly competitive environment, Aricent is trying to capture the market on the basis of acquisition.
Further,
Aricent missed the IPO affect its client confident. Aricent is facing fund
restraint in expanding its footprint further in the country. If it would be
able to launch IPO, this would have a positive impact on the company’s
reputation and it would help the company to further reach the capital market
for funds to expand its business.
The company has done an acquisition of smart play in 2015 and consequently, the loan book of the company has increased considerably. This lead to an increase in the interest burden putting a lot of presser on the company’s financial statement. Apart from the interest burden, the company has losses on account of the exchange rate due to weakling rupees. The fall in GDP since 2015 on account of slow down on demand-side as well as poor performance of the service sector hits the company profit as well.
5 to 7-page reflective paper summarizing your current and/or personal philosophy on performance measurement. It is to be double spaced, no cover sheet, 12 point Times New Roman and should reference class readings and activities (4 to 6 hours). You do not need a reference section if you are using the class readings that your instructor is familiar with.
A performance measurement gives us a numeric outcome of an analysis that shows or indicates how efficiently an organization is achieving its objectives. These measurements technique can be used to gauge the performance of different aspects of a business, including accounting, engineering, finance, marketing, materials management, production, research, and sales departments. For Example:
It can help us to track the ability of the accounting department to collect overdue accounts receivable i.e. account receivable turnover.
It can help us in tracking the speed of the engineering department in designing new products.
It can help us in tracking the liquidity of funds available to the finance department.
It can help us in tracking the amount of inventory maintained by the materials management department i.e. inventory turnover.
It can help us in tracking the amount of scrap produced in the production department
It can help us in tracking the ability of the sales staff to bring in new sales from existing customers i.e. the efficiency of the salesforce.
Production cycle time the amount of time required to turn raw materials into completed products from the time raw materials are received to the time goods are transferred to finished goods inventory. In some cases, defective products are reworked before being transferred to finished goods that are considered as rework time in cycle time.
Delivery
cycle time is the amount of time required to get the finished product to the customer
(from customer order receipt to the time the goods are shipped); it will also
include the wait time between order receipt and the start of production as well
as production cycle time.
Rework
time is the amount of time necessary to correct for defects found in products
by product inspectors. The consulting department accounted for rework time
separately from original work time; as such, rework time was not incorporated
into the direct labor time variance.
The dashboard of performance measurements containing the summary sheet that will be distributed to the management team regularly. The shortfall in any department will attract the attention of management and a quick enhancement action can be taken.
Another
way of performance measurement is the use of revenue centers, profit centers,
and cost centers to measure the efficiency of different business segments. A
revenue center is responsible solely for the amount of revenue it generates,
while a profit center is responsible for both the revenues it generates and the
costs it incurs. A cost center is only responsible for the costs it incurs.
Nearly all parts of a business can be broken down into one of these
classifications.
The
basic objective of performance management is :
1.
Analyze standard cost variance results and identify the causes.
2.
Analyze changes in non-financial operating measures and Identify the causes.
3.
It helps us to understand the importance of aligning performance measurement with
organizational vision and strategy.
4.
We will be able to apply balanced scorecard concepts to evaluate an existing
performance measurement system.
5.
It will help us to understand the benefits of the balanced scorecard approach
to performance management.
6. It helps us to articulate an organization’s business vision and strategy and after that, we can construct a balanced scorecard based on it.
7. We can effectively communicate the results of an analysis in a standard way that management can understand and take required measures.
Effective performance measurement helps us in ensuring that the strategy of an organization is successfully implemented. It monitors the organization’s effectiveness in reaching its own predetermined goals or stakeholder requirements. A company needs to perform in all aspects from cost, quality, flexibility, value to other dimensions. A performance measurement system that makes a company capable to meet these demands successfully is essential. It helps management to make better and informed and more effective decisions at both strategic and operational levels. Performance measurement is not only about purely financial performance measures like profit, cash flow or the return on capital employed (ROCE), now it emphasizes non-financial and multidimensional performance to achieve its organization’s goals. Due to drawbacks and inefficiency in traditional (financial) performance measurement have led to enhanced measurement techniques to understand the functioning of the company better on all its pillars.
Some of these are the Balanced Scorecard, which is based on four distinct perspectives (financial, customer, internal process, and learning and growth). These perspectives cover the whole of the organization’s activities both internally and externally, both current and future.
A balanced scorecard is a performance measurement metrics used in strategic management to identify and enhance the internal functions of a business and outcome attributing to external factors. It provides the tools and feedback to organizations to enhance its activity pertaining to the management of the operation of the business. Data collection and interpretation provide quantitative results that form the backbone of management and executive decision regarding the operation of the company.
The balanced scorecard reinforces good behaviors in an organization by isolating four separate areas or also called legs that learning and growth, business processes, customers, and finance. The balanced scorecard helps us to attain objectives, measurements, initiatives, and goals that are outcome of the four pillars of the balanced scorecard. This helps the company to easily identify factors that hinder company performance and make strategic changes as required based on future scorecards. A balanced scorecard enables them to look at the company as a whole when viewing company objectives. An organization may use the balanced scorecard to implement strategy mapping to see where value is added within an organization as a result of strategy implementation. A company also utilizes a balanced scorecard to develop strategic initiatives and strategic objectives.
The Four Legs of the
Balanced Scorecard
Information in a balanced scorecard is consisting of four aspects of a business. First, learning and growth are analyzed through the investigation of training and knowledge resources and then they are analyzed.
This
first pillar deals with how well information is captured and how efficiently
employees utilize the information to convert it to a competitive advantage over
the industry.
Second,
business processes are then evaluated by investigating the process and quality
products are manufactured. Operational management is analyzed to identify any
gaps, delays, bottlenecks, shortages or waste.
Third, customer perspectives are collected to understand customer satisfaction with quality, price, and availability of products or services. The feedback of the customers are taken in regard to their needs are being met with current products.
Finally, financial data like sales, expenditures, and income are analyzed to understand financial performance. These financial measures may include dollar amounts, financial ratios, budget variances or income targets.
These four legs encompass the vision and strategy of an organization and need the attention of the management to analyze the data collected. Therefore, the balanced scorecard is a very important management tool, but not only a measurement tool.
Performance measurement is an important tool of strategic analysis and it also helps stakeholders of the company to understand an organization’s strategy from observing the match of goals and actions of the company.
Performance measurement is applicable to every industry sector and to types of the firm whether small or large and sizes, public or private and for-profit or not-for-profit. Management accountant plays an important role in providing decision making information for performance measurement and helps to development or refining of performance measurement systems. The management accountant should also ensure that measures implemented are inconsistent with the chosen management techniques, such as VBM or ABM. With the growth in popularity and maturity of enterprise risk management (ERM) and performance measurement, companies are starting to integrate the two disciplines to better manage risk, while improving their overall performance measurement systems. For example, companies are using risk-adjusted rolling forecasts and integrating their risk and performance measurement processes.
Thank you for visiting our case study solution. You can find the case solution below. But before reaching there let us provide you some insight about our amazing offers and discounts. We provide solution for case studies and questions as less as in 30 minutes and for as low price as $20. Our solutions will be original and plagiarism free. Reach us at assignmenthelp.em@gmail.com or WhatsApp us +1(210) 951-4463
Q. What is the competitive situation faced by Wilkerson?
A.
Competitors are reducing the price on pumps that in turn forcing Wilkerson to cut its prices too. This took the pre-tax margin below 3% and gross margin to 19.5% which is way below the planned gross margin of 35%. Production of Pumps is most costly but it gets the lowest margin in the Wilkerson product line as it is selling at $20 below the targeted price.
The flow controller is the most resource-intensive product as it requires more components and resources but it is not getting the appropriate revenue because of the inappropriate current volume-based costing method. Therefore even when Wilkerson increased the price of the flow controller, the demand remains the same.
Demand for valves are less elastic as compare to pumps in the commoditized market and can be produced and shipped in large quantity so it can benefit from economies of scale. Thus Wilkerson can increase the price and its profit margin on the valves.
Q. Given some of the apparent problems with Wilkerson’s cost
system, should executives abandon overhead assignment to products entirely by
adopting a contribution margin approach in which manufacturing overhead is
treated as a period expense? Why or why not?
A.
Yes, Wilkerson should use the contribution margin approach as it recognizes the variable and fixed cost and can be attributed to each product i.e. valve, pump and flow control based on the machine-related expense, setup labor, receiving and production control, engineering and packaging, and shipping.
In the present costing method, the manufacturing overhead is estimated by multiplying direct labor cost with 300%. This estimation is not accurate and allocates the wrong cost to the product which results in mispricing which costs the company with losses.
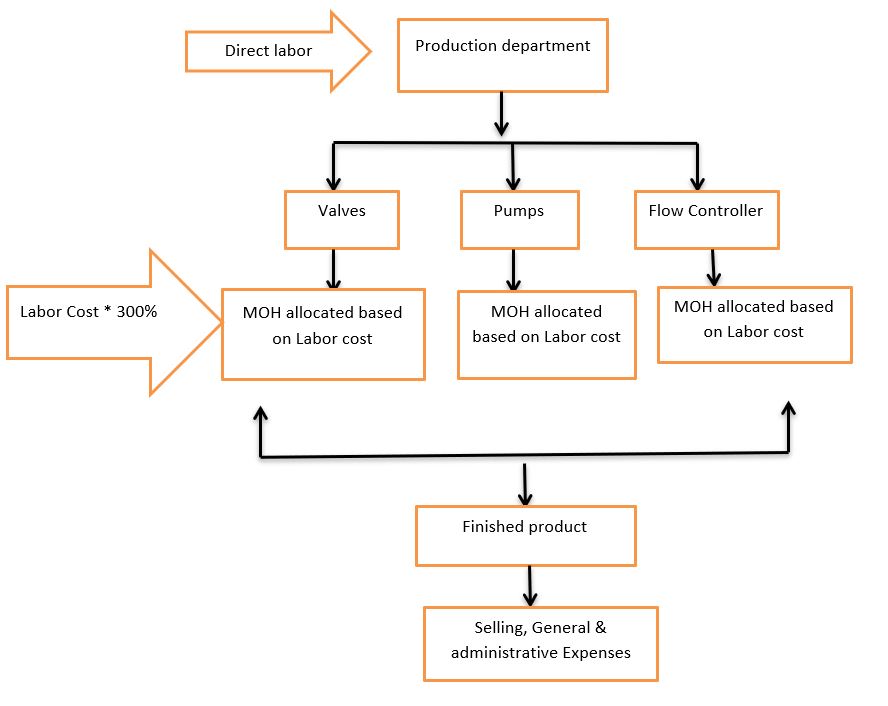
Q.
How does Wilkerson’s existing cost system operate? Develop
a diagram to show how costs flow from factory expense accounts
to products. In other words, how do machine expense, set-up labor,
receiving/production control, engineering, and packaging/shipping costs get
allocated to valves, pumps, and flow controllers?
A.
In the current system, the manufacturing overhead is allocated based on the direct labor cost. The labor cost is multiplied by 300% to reach the total cost.
Q.
Diagram an activity-based cost model using the information
in the case.
A.
Q.
What difference does your ABC cost assignment have on reported
product costs and profitability, as compared to the standard costing
profitability reported in the Case Exhibit 2 for valves, pumps, and flow
controllers?
A.
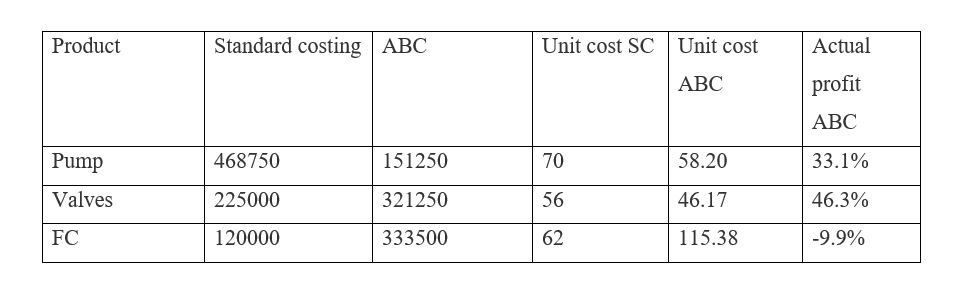
In the case of standard costing, there is no recognition of activities that are part of the production and manufacturing overhead is allocated based on labor cost multiplied to 300%. According to standard costing the company is earning a profit of 34.9% on Valves, 19.5% on pumps and 41% on Flow controller.
In case of ABC costing the different activity has been recognized namely machine-related expense, setup cost, receiving and production control, engineering and packaging, and shipping. The overhead cost allocation under ABC and Standard costing are as follow:
In ABC we can see that the actual profit margin in the valve is 46.3% against reported of 34.9%. In the case of the pump, the gross profit is 33.1% as against reported profit margin of 19.5% and inflow controller, the company is actually incurring loss instead of profit of 41%.
Q.
What actions might Wilkerson’s management team consider to
improve the company’s profitability?
A.
The Wilkerson’s management should adopt ABC costing as it reveals the real costing of the product. Under this, the management can understand that it can reduce the price of the valve to compete better and it can comfortably increase the price of the flow controller as it is in the loss as even in price increment of flow controller the demand does not go down. It will help the management to understand the cost behavior and making a proper pricing strategy.
Q.
Wilkerson has been compensating salespersons with commissions on their gross sales volumes (fewer returns). Parker wonders whether the company should change this incentive system. What is your advice on this matter?
A.
Currently, the commission is totally dependent on gross sales value. In this case, the high price product will be pitched by the salesperson. The highest-priced product, in this case, is Flow controller but in actual by selling this the salesperson is giving loss to the company as ABC costing showing it at a loss when sold for that price.
Thus the sales commission should be based on the gross profit rather than sales value. In this case, the salesperson will try to sell those products that carry maximum profit.
Do you sense any alignment between the Indian monetary policy and the US Central Bank policy? Substantiate the same.
Answer:
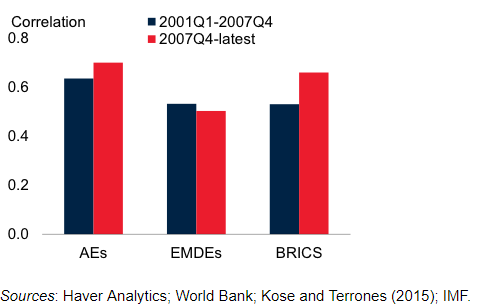
Monetary policy, especially in large industrial countries with open capital markets shapes global capital flows. Many such countries particularly following zero rate policy results in capital flows eventually finding homes in places like India, and emerging economies. Business cycles in the US, other advanced economies (AEs), and emerging market and developing economies (EMDEs) have been highly synchronous (Figure below). This shows the extent to which global trade and financial linkages of the US economy with the rest of the world at the same time these global shocks drive common cyclical fluctuations. Other countries tend to be in the same business cycle phase as the US roughly 80% of the time. Although it cannot and an easy task to establish empirically whether the US economy leads the business and financial cycle turning points in other economies, recent research shows that the US seems to influence the timing and duration of recessions in many major economies (Francis et al. 2015).
The figure below shows the correlation between the US and other economies of the world.
Monetary
policy, especially in large industrial countries with open capital markets
shapes global capital flows. Many such countries particularly following zero
rate policy results in capital flows eventually finding homes in places like
India, and emerging economies. Business cycles in the US, other advanced
economies (AEs), and emerging market and developing economies (EMDEs) have been
highly synchronous (Figure below). This shows the extent to which global trade
and financial linkages of the US economy with the rest of the world at the same
time these global shocks drive common cyclical fluctuations.
Other countries tend to be within the same variation section because of the US roughly eightieth of the time. Although it cannot and an easy task to establish empirically whether the US economy leads the business and financial cycle turning points in other economies, recent research shows that the US seems to influence the timing and duration of recessions in many major economies (Francis et al. 2015). The figure shows the high positive correlation of the US Business Cycle with other Economics in the world.
Since 2008, after the financial crisis, the US followed quantitative easing and zero-interest framework. This led investors from across the world to emerging countries like India for higher returns with higher risks. Institutional investors in the US and other developed economies deploy trillions of dollars in various financial instruments around the world. Such as the US as well as international equity markets, US along with other international bond markets, US and other countries’ government bonds, real estate, venture capital, commodities, and private equity, derivatives, etc. These institutional investors have some annual target rate of return which they need to achieve. For instance, a public pension fund may seek annual return of a three-to-four percent, five-to-eight percent may be targeted by an endowment, whereas a hedge fund might target 15 to 20 percent. Thus they start looking for higher returns outside their countries in the regime of zero rate policy thus increased return means increased risk.
Lower interest rate and quantitative easing lead to zero interest rate policy in the US after the 2008 crisis. This means that bonds and other financial instruments in the US were less attractive for short term investors. They will start looking for an option outside the US i.e. into other emerging economies like India where there is higher return with higher risk. This lead to huge inflow of FDI in India in 2014 and ahead. The country surpassed its earlier records in terms of FDI and even the stable government and its initiative make it an attractive destination for institutional investors.
Soon when the US was released that Zero rate policy helped them to make the economy stable, control deflation and reached desired inflation rate, unemployment went down than in 2013 amid form mounting uncertainty about global economic prospects, increasing oil prices, growing political and economic tensions in the euro area, and strong monetary policy responses the US hinted to increase it interest rate, though there’s been some fallout from these financial market developments, none has threatened financial stability. This triggered substantial amount of credit to flow into bond markets through mutual funds and ETFs; Some rise in dollar interest rates and the dollar exchange rate is to be expected as U.S. monetary policy firms; so higher interest and exchange rates are ways in which tighter policy is transmitted to the economy to restrain early inflation pressure.
But
an unexpectedly sharp rise in rates or increase in volatility could reveal
weaknesses and mismatches among borrowers that have not been anticipated by investors.
And the effects could be especially felt in emerging market economies like
India, which had been the recipient of so much of the flows seeking higher
yields.
Now From 2013, the Fed continues to implement quantitative tightening and the large issuance of government paper by the US Treasury as a result of the Trump administration’s fiscal policies. In response, RBI raised its repo rate by 25 basis points to 6.25 percent. The increased rate is a response not only to the risks to the inflation target that have emerged recently but also the risk of capital exiting emerging market economies. Institute of International Finance data shows that in May a combined US$12.3 billion of outflows in bonds and stocks in one month. With such a high scale of capital outflow, it’s easy to see why countries such as India and Indonesia, as well as others such as the Philippines and Turkey, have had to hike domestic rates recently.
Capital outflow from emerging economies, as data from Thomson Reuters, shows that capital is flowing to US-based money market funds which saw inflows of nearly US$34.9 billion from investors worldwide were drawn to the mixture of upper US yields and perceived lower risk.
In addition, higher interest rates in the US put pressure on emerging market economies to increase their interest rates to save and secure their investment inflows. The monetary tightening policy of RBI in response to a hike in interest rate by the US was inevitable. Thus RBI Hiked the policy rate by 25 basis points to 6.25%. This was the first hike by RBI since 2014. This hike in the policy rate will restrict some outflows and reduce the pressure on the INR to depreciate. Though the reduction in rates by RBI may reduce inflation in the Indian economy as money will become more expensive to borrow, this can also result in a slow economic activity and hinder investment activity.
Question:
Analyze
the impact of the Federal Reserve Bank rate on the Indian economy.
Answer:
Increase in interest rate by Fed, which means it will create pressure on RBI to increase its policy rate that could result in fewer jobs in India; a decrease in economic activity will lead to companies refraining from hiring new workers. Fed rate hike can have short-term implications on the Indian financial market, but RBI’s monetary policy tightening will not have a favorable effect on the Indian economy.
US is following quantitative easing and zero-interest framework from 2008 i.e. from the time of global financial crisis till 2014, after which the US Fed has raised its benchmark short-term interest rate for the seventh time, and the second time in 2018, by 25 basis points to a range of 1.75-2%. As the US economy seems to be stable and its objective well achieved—the inflation rate of 2.9% in May 2018 was higher than the targeted rate of 2% and a lowest unemployment rate of 3.8% in the last two decades. These recent hikes and further expected hikes will have major implications for India and emerging market economies as this will increase liability on dollar-denominated debt, capital flows, exchange rate appreciation, and inflation.
The hike is expected to be followed by other developed countries that have been following zero-rate policies such as Japan and other European countries. This will lead to a further outflow of funds which will weaken the INR against the US dollar, moreover, the increase in US government securities rates will put pressure on India and other emerging economies’ government bond yields. The equity investment will also route out from emerging economies towards the US market as the hike and better economic conditions in the US will boost the confidence of investors. The Reserve Bank of India (RBI) data shows, the sharp decline in net portfolio investment to India after the hike in March 2018. In fact, the net portfolio outflow is $3,133 million versus the net portfolio inflow of $1,159 million between March and April 2018.
Current account deficit—increased from 0.6% of GDP in FY2017 to 1.9% in FY2018 due to the slowdown of short-term capital inflows which will put pressure on INR. INR had been already depreciated around five-hitter since the last Fed’s hike in March. Weakling rupees will lower the rate of return which will make Indian equity less attractive for foreign investors.
A weaker rupee will increase the import bill and inflation. Thought Export can be promoted under these circumstances to counter the negative effect. But this may not be enough as we have large import bills when capered to our exports. India’s carries it trade majorly in the dollar, either a stronger dollar or a weaker rupee can help reduce India’s trade deficit.
Analyze the change in oil prices in the last one year and its impact on the Balance of payment of the country.
Answer:
Oil is one of the most major sources of energy which contribute 27.3% of global primary energy demand. Oil is a limited resource and will not last forever. In 2015, oil reserve to production ratio was at 50.7 which means if oil continued to produce at this rate, it would last about 51 years. Thus scientists are working hard to explore alternate sources of energy. Besides, those geoscientists are busy finding out new sources of oil and exploring unexplored reserves. Tight oil and shale oil are becoming techno-commercially to produce and market. In recent times, unconventional oil and gas resources significantly impacted the dynamics of global oil & gas trade. In fact, these unconventional oil resources have increased the supply of oil in the global market which resulted in a fall in global oil prices. Moreover, the OPEC liberalized its high price policy by cutting the production significantly against its prior policy of producing an artificial shortage of oil in the global market to increase the price. The graph below is showing how the high oil price in 2014 fell significantly at the end of 2014.
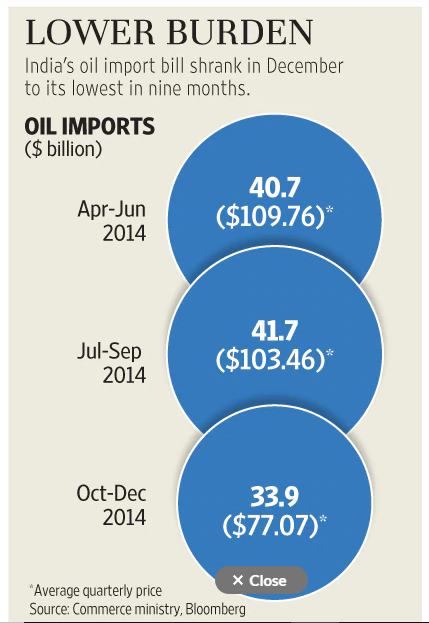
The figure below shows International Oil prices from Jan 2014 to Aug 2018
Lower oil prices shrank India’s oil import bill when the oil prices fall from $110 per barrel to less than $45 per barrel in January 2015. In December 2014, oil imports fell 29% to $9.9 billion from $13.9 billion as compared to the same month of 2013. At this time there was slower growth in gold imports, helped India to lower its import bill and narrow its trade deficit in the month.
The fall in import bill in 9 months in by 4.78% to $33.9 billion, mainly because of lower oil imports, but on the other hand, exports dropped 3.77% to $25.3 billion. As the fall in imports was greater than the fall in export, it narrowed the trade deficit to $9.4 billion from $10.1 billion a year ago. The fall in oil prices will help the government to lower its subsidy burden as well as provide some relief to the external sector by keeping the current account deficit in check and hence ease pressure on the rupee. More correction in crude oil prices will improve India’s current account balance.
The figure bellows shows the shrank in import bill due to the fall in oil prices in 2014.
Recently the plummeting rupee and increasing fuel prices due to global factors set to weakling already weekend currency, widen current account deficit and affect its growth outlook. Rebounding oil prices after huge fall from 2014 in combination with India’s unrelenting demand for oil will push up oil imports and widen its current account deficit that measures the flow of goods, services, and investments. The increasing deficit will further weaken rupee, as more imports mean the country will need to buy more foreign currencies to meet its needs. This challenging global environment has made the Reserve Bank of India (RBI) intervene aggressively this year to contain rupee depreciation and also the drawdown in foreign reserves has been significant.
India’s is a country that heavily relies on imported oil and gas, the rising world oil prices have significantly inflated the oil import bill. Due to this India’s trade position deteriorating, with July’s trade deficit hitting a five year high. Oil prices have shot up this year, reaching $80 a barrel in May for the first time since 2014. The OPEC-led output cut, falling Venezuelan and Libyan output, as well as by an imminent drop in Iranian exports as U.S. sanctions return in November this year boosted the oil price to the highest. It is being speculated that the oil import bill in the fiscal year 2019 could spike above $114 billion. Oil imports were about $88 billion between 2017 and 2018 which is higher than the previous year’s cost of $70 billion.
India needs to bring its oil demand down that will lower the oil imports; this will help India to make growth more resilient. According to a report, India’s oil demand will increase to 4.4% annually in the next ten years, compared to 3.7 per year in the last 10 years. This rising oil imports can hit India’s gross domestic product badly in the long term.
Question:
Also, analyze its impact on your company.
Answer:
Altran
Technologies SA, a technology consultant main business areas are as follows:
Automotive industry – Due to continuous increase in oil prices and limited availability of oil resources the company is increasing the budget development of autonomous and connected vehicles and tackling the related safety and security issues; environmental issues (energy efficiency, electric vehicle) and development of so-called “green” mobility; and search for new mobility models.
Aeronautics – It has also increased its R&D in developing fuel-efficient aircraft and align its properties according to the Industry 4.0 norms.
Space, Defense, and Naval – This sector needs huge energy resources that are provided by oil and increasing oil prices to have a significant impact on its cost sheet.
Energy – In the oil and gas segment the increase in the price of the oil help them to increase their top line but this might now be a permanent solution as there is regular research going on developing alternative and unconventional energy resources such as sail oil etc.
Industry and electronics – n the electronics and semi-conductors segment, growth should be driven by the search for electronic components that are more rapid, miniaturized, mobile and low in energy consumption, on the one hand, and by the development of embedded systems, particularly for the automotive industry, and connectivity with the Internet of Things (IoT), on the other hand.
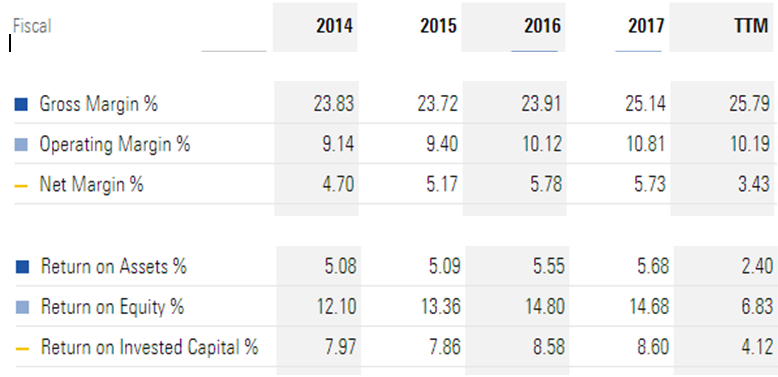
Thus we can see Altran Group has high exposure to oil and gas prices as its business is concerned. The effect of high oil prices can be seen in the basic financial ratios of the company given below.
The
figure below show profitability ratio of the company for last 5 year.
We can see hoe the Profitability ratio has gone up from 2014 to 2016, but it’s coming down henceforth. This is basically because the company was able to bring its operating expenses down when the oil prices were going down but after 2017 when oil prices started going up, it started hitting the profits of the company.
Oil prices can hit the company in two ways, in the automotive industry, for instance, the oil is a complimentary product to cars, the demand for which comes down as in the reign of high oil prices the consumers postpone their purchases. In can of the energy sector, the product itself is oil and an increase in the price may increase the revenue of the company but it can also drop the overall demand on the flip side. In a heavy industry where there is a high need for power for which oil can be the primary source of energy, oil being at a higher price will increase the cost to the company and that will pull down the profits of the company.
Technology – Processes a firm uses to turn
inputs into goods and services
Technology depends on – the skill of its managers, training of its workers, speed and efficiency of machinery/equipment
Technological change – a change in the
ability of a firm to produce a different level of output with a given quantity
of inputs
The input requirement set is the set of all input bundles required to produce at least a given level of output.
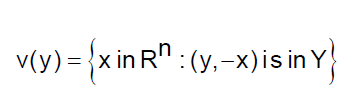
(y,-x) Net output bundle where –x is input
Y is a set of all technological production plan i.e. firm’s production possibility set.
V(y) Input requirement set.
Rn is a production plan
The isoquant gives all input bundles that produce exactly y units of output. In other words, an isoquant is the combination of all inputs that produce the same level of output i.e., y.
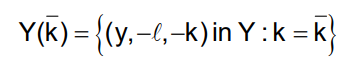
SHORT-RUN PRODUCTION POSSIBILITY SET
Y(K) is production possibly set when capital is fixed
Y is output
L is labor
K is capital
A production
function relates quantities of physical output of a production process to
quantities of physical inputs or refers to the technological relation between
physical inputs and outputs of the goods.
The production function for a firm which
has only one output can be defined as
With one combination of input (x), we can
get the maximum possible output (Y) then it is production function.
Transformation
Function
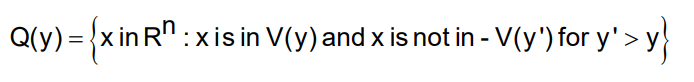
A production plan y in Y is technologically efficient if there is no y’ in Y such that y’ y and y’ y ; in other words, a production plan is efficient if there is no other way to produce more output with the same inputs or to produce the same output with fewer inputs.
The set of technologically efficient
production plans can be described by a transformation function:
The Cobb–Douglas production function is a particular functional form of the production function, widely used to represent the technological relationship between the amounts of two or more inputs (particularly physical capital and labor) and the amount of output that can be produced by those inputs. The Cobb–Douglas form was developed and tested against statistical evidence by Charles Cobb and Paul Douglas from 1927–1947.
Y = total production (the real value of all goods produced in a year or 365.25 days)
L = labor input (the total number of person-hours worked in a year or 365.25 days)
K = capital input (the real value of all machinery, equipment, and buildings)
α and β are the output elasticity’s of capital and labor, respectively. These values are constants determined by available technology.
Sometimes the term has a more restricted
meaning, requiring that the function display constant returns
to scale, meaning that doubling the usage of capital K and labor L will also
double output Y. This holds if
α + β =
1,
If
α + β <
1, returns to scale are
decreasing,
and if
α + β >
1, returns to scale are
increasing.
In economics, the Leontief production function or fixed proportions production
function is a production function that implies the factors of production will
be used in fixed (technologically pre-determined) proportions, as there is no
substitutability between factors. It was named after Wassily Leontief and represents
a limiting case of the constant elasticity of substitution production function.
For the simple case of a good that is
produced with two inputs, the function is of the form
where q is the quantity of output produced,
z1 and z2 are the utilized quantities of input 1 and input 2 respectively, and
a and b are technologically determined constants.
ACTIVITY
ANALYSIS
The most straightforward way of describing
production sets or input requirement sets is simply to list the feasible
production plans.
The same Output can be produced using inputs 1 and 2, where it is possible by two technology (i.e. Combination of input) Tech 1, one unit of factor 1, 2 unit of factor 2. Tech 2, 2 unit of factor 1 and 1 unit of factor 2)
The marginal
rate of technical substitution (MRTS) is the rate at which one factor must
decrease so that the same level of productivity can be maintained when another
factor is increased. The MRTS reflects the give-and-take between factors, such
as capital and labor that allow a firm to maintain a constant output. MRTS
differs from the marginal rate of substitution (MRS) because MRTS is focused on
producer equilibrium and MRS is focused on consumer equilibrium.
Like the pace of the moving car, one needs not worry about the heart rate until it’s not absurd i.e. it is not too fast, not too slow, and not too erratic. One is more likely to be completely unaware of the regular activities of the heart rate unless something unusual happens.
Heart Rate indicates the functioning of the Heart and this is why it’s so important. Throughout the body oxygen and nutrient-rich blood is circulated with the help of the heart. Almost everything is affected when the heart starts dysfunctioning. Heart Rate is the key element as the function of the heart or the cardiac output is directly related to heart rate and the amount of blood pumped out with each beat).
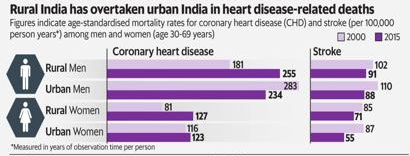
The deaths caused by cardiovascular diseases have been on the rise to become the leading cause of death in India. While in US the cardiac diseases caused death rate has declined significantly in the last 15 years. It’s the point where India needs to take the cue to understand the need to adopt population-level strategies to reduce risk factors.
The ratio of the distribution of the 30 million heart patients in India, in urban areas to that in rural areas, is 7:8. And if go by the trends the year 2020 will be the year to mark the surpassing of the burden of atherothrombotic cardiovascular diseases that of any other country in the world.
The product ZAP Band not only keeps the record of your heart rate but also gives you a warning when there are abnormalities noticed in your heart rate. Moreover, it is also useful for those youngsters and mangers that have to wake up early or have an important meeting scheduled but always miss the alarm. This band with mild electric shock (vibration) feature tends to give an unavoidable reminder for your scheduled tasks.
Product
Zap band is a health band that provides multiple utilities to its customers, ranging from Heart rate monitor, Physical activity mapping, Time, Alarm with additional vibration (Tickling effect) notification. As against most of the health band available in the market, it is unique in its notification way and also the use of Artificial Intelligence (AI) inaccurate mapping of your heart rate and giving you notification on the erratic pattern.
We have multiple value propositions or USP
Affordable – Zap band is a low priced product that focuses on rural markets where the customers are of low-income category. From our study, it was found that the number of patients in rural India is increasing more rapidly against in urban India so there is an urgent need to bring low priced and affordable products of this kind.
Electric Tickling – It is one of the most unique features of our product that tickles you like your partner and wakes you up in good humor. It’s also a kind of notification which cannot go unattended however busy you may be. None of our Competitors has such features so as long as there is no substitute this will be our USP.
Based on AI –With the advent of Artificial Intelligence (AI) in the health sector, it was relevant to put its application in it too. In such a busy life it is not possible to take care of even one’s own health and to take note of minor changes happening in our body pattern which might be indicating some upcoming major setbacks. But this AI-based Band will help an individual by recording the activities of heart and heart rate patterns to analyze them and notify any abnormalities to the person.
Market Analysis
The potential customers of the ZAP band have been segmented into two major groups based on their geographical locations and two subgroups based on their demographics. The first categorization consists of heart patients based in rural India and others based in Urban India.
The chart below shows the trend that a number of heart disease patients in rural India is surpassing the numbers of urban India. Most of the rural population is not capable enough to afford costly Health Bands that are available in the market ranging between RS 2000 to RS 3500.
The other categorization has been done of people who are not heart patients but want to keep track of their heart rate pattern as it is an important indicator for a healthy lifestyle. These consist of a youngster age between 25 to 30 and people above 34 years of age.
Most professionals will also be our target customers as the band has utility for them as well. It works as an alarm that cannot be avoided or can go unnoticed. Thus the market size roughly consists of a large number of potential customers, to which we need to give knowledge and usefulness of the product. We can reach these customers only through mass media and thus need a different channels and different media.
Number of heart
patients in India = 30 Million (Economic Times article quoted by Health
Minister of India in 2015)
Number of Youth in the country
The core target segment of potential customers includes the patients of population of 30 Million. We will try to target them through collaboration with the doctors and other medical attendees. This segment will help us to get immediate customers that are in real need of such affordable bands to keep a check on their heart rate.
The second group
of target customers that include youngsters and professional, which is a large
market segment need to be fragmented further on their geographical bases. This
will help us to approach this segment strategically and economically as we will
have to make them aware of the product
Competitor analysis
The industry we will be operating in is the Health sector and the product will fall under the health equipment. The health sector is one of the fastest-growing industries in India with an increase in per capita income in rural and urban India. Recently launched Ayushman Bharat or PMJAY that gives Rs 5 Lakh of insurance to bottom 40% of the population is also a big boost to the health sector.
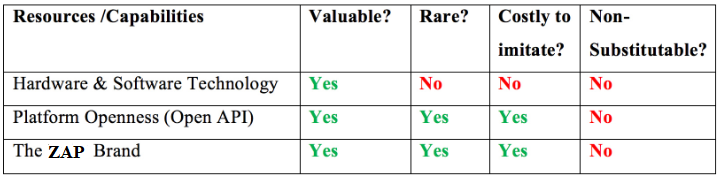
Porter’s Five Forces
Competitive rivalry – There are many competitors such as Fastrack, Apple, FitBit, Lenovo and others which create high rivalry in the market. Almost similar features but our product has USP of Mild Electric shock to create a warning or notification. The product can be easily imitated.
Bargaining power of suppliers – The product as lower supplier power as it has moderate switching cost and manufacturing is generally outsourced and have a lot of substitutes. There is no threat of forwarding integration.
Bargaining power of customers– The product has high bargaining power as a wide price range and options are available. People demand more and more feature at a lower rate and have low switching cost that makes it more vulnerable.
The threat of new entrants – There is a moderate risk of the new entrant but we can have a first-mover advantage with the feature of mild electric shock as a notification. The market has huge potential as there is a lack of awareness among people in rural as well as urban India regarding heart disease and threats related to the heart.
The threat of substitute products or services–There is a large number of competitors in the market and hence high substitution option but as mentioned our band will give strong notification for anything that will be mapped signaling. People have low brand loyalty as an upcoming new features keep luring customers from one brand to other.
The product will be a success if it is able to do accurate and on-time signaling about symptoms of heart disease that can be mapped by the erratic pattern of heart rate and leading to an early diagnosis of disease. The Artificial Intelligence-based feature helps customers and patients to get a warning about their health issues and meet doctor on time to avoid unnoticed major problems. People using the ZAP band in our clinical test found that they are 80% more prompt to meet doctors and take consultation to avoid any major setback. The vigilance among the users regarding their overall health also increased.
Our Direct competitors
FastTrack – The best way to reap the benefits of a healthy diet is to combine it with a physically active lifestyle. Jog a little, run a mile, walk up a flight of stairs or get a good workout, this Fastrack smart band records every move you make. One can set goals and keep track of his progress using this smart band. It also comes with a sleep monitor which measures the amount of sleep you get.
Lenovo – From setting
alarms to tracking your fitness activities – keep an eye on everything as you
adorn your wrist with this smart band from Lenovo. It lets you adopt a healthy
lifestyle by helping you to monitor your sleep and heart rate. This device can
be charged directly via a USB port. It is compatible with Android and iOS
devices.
Apple – Monitoring of
heart rate Real-time monitoring and recording, scientific planning exercise,
Automatic sleep monitoring analyzes your sleep quality. Monitor your activity
levels, track walking distance and calculate calories burned. Achieve the daily
exercise targets you set and with the app to analyze your fitness and sleep
activities to help you improve your lifestyle.
Fitbit – Of all the things that one should do to give up the sedentary lifestyle, keeping a track of the calories that he/she is burning is really important. And, you can do that using the Fitbit Charge 2 smart band. Boasting an OLED Display and Interchangeable Bands, this smart band uses the PurePulse Heart Rate feature to track your heart rate and the calories that you burned, so you get the physique that you’ve been striving so hard to achieve.
Indirect Competitors
Coffee – Coffee may cause mild increases in blood pressure, which usually diminish over time. Coffee drinkers do not have an increased risk of heart disease and have a slightly lower risk of stroke. Moreover, it helps us to start an energetic day.
Alarm Clock – Alarm clock helps us to get up early morning but most of the time we fail because we switch off the alarm and get back to our bed. Our product provides you mild electric shock that helps you to refresh by vibrating your nervous system with a tickling effect.
In terms of competitive advantage, we have lowest and affordable price with the additional features of mild electric shock notification. This helps us to not only penetrate the market but also to reach the lower segment of society who are still not able to afford high-end, health bands.
Competitors such as Apple, Fasttrack and Lenovo have a brand image that they enjoy already among the masses because of their other market product. But as their products are highly-priced, they focus on the premium segment of the market.
Awareness and price cut by the competitor are two major threats we can face in the market. As most of the products in this category are highly-priced, there is a good chance that competitors can cut their price to gain the market share as they are known brands in the market. Awareness is also a big challenge. In rural India where we will be focusing more have low-income people and the awareness among them about heart disease, preventive measure is minimal. Thus to educate them about such products and their usefulness will be a big challenge. We can collaborate with the local rural doctors and dispensary attendants to promote and push the product to rural customers who are in need of it and also motivate youngsters to remain healthy by the use of the ZAP band.
SECTION I A. 1. There are four possible shocks that can occur in an economy: A. Positive demand shock (e.g., consumer confidence increases) C___ B. Negative demand shock (e.g., the stock market has done poorly and people feel poorer) B___ C. Positive supply shock (e.g., new technology leads to cost savings in many industries) A_ D. Negative supply shock (e.g., the cost of oil rises due to increased unrest in the Middle East) D_ Determine which of the following statements best describes each of the shocks. Enter one letter (from the list below) of your choice for each shock described above. a. It would be good regardless of the current state of the economy. b. It would be good if the economy is in an inflationary gap. c. It would be good if the economy is in a recessionary gap. d. It would never be good for the economy. B. Explain whether the following government policies affect the aggregate demand curve or the short-run aggregate supply curve and how. What will happen to the aggregate price level and aggregate output in each case? a. The government reduces the minimum nominal wage.
The government reducing the minimum nominal wage would shift the (AD, SRAS) SRAS____
curve to the (right or R, left or L) R______.
This would (increase or +, decrease or -) – the aggregate price level and (increase or +,
decrease or -) +__ aggregate output.
b. The government increases Temporary Assistance to Needy Families (TANF) payments, government transfers to poor families with dependent children.
The government increasing TANF payments would shift the (AD, SRAS) AD____ curve to the
(right or R, left or L) R____.
This would (increase or +, decrease or -) – the aggregate price level and (increase or +,
decrease or -) I aggregate output.
c. To reduce the budget deficit, the government announces that households will pay much higher taxes beginning next year.
The increase in taxes would shift the (AD, SRAS) AD curve to the (right or R, left or L) L.
This would (increase or +, decrease or -) D__ the aggregate price level and (increase or +,
decrease or -) D aggregate output.
d. The government reduces military spending.
The decrease in military spending would shift the (AD, SRAS) AD__ curve to the (right or R, left or L) L____.
This would (increase or +, decrease or -) -_ the aggregate price level and (increase or +, decrease or -) -_ aggregate output. C. An economy is in long-run macroeconomic equilibrium when each of the following aggregate demand shocks occurs. (1) What kind of gap—inflationary or recessionary—will the economy face after the shock? (2) What type of fiscal policies would help move the economy back to potential output? (3) How would your recommended fiscal policy shift the aggregate demand curve?
a. A stock market bust decreases the value of stocks held by households.
A decrease in the value of stocks held by households would cause aggregate demand to (increase or +, decrease or -) – resulting in a(n) (inflationary or I, recessionary or R) _R___ gap.
(Contractionary or C, Expansionary or E) E__ fiscal policy would help move the economy back to potential output by shifting the aggregate demand curve to the (right or R, left or L) R______.
b. Firms come to believe that a recession in the near future is likely.
Firms expecting a recession to occur would cause aggregate demand to (increase or +, decrease or -) – resulting in a(n) (inflationary or I, recessionary or R) R__ gap.
(Contractionary or C, Expansionary or E) E__ fiscal policy would help move the economy back to potential output by shifting the aggregate demand curve to the (right or R, left or L) _R.
c. Anticipating the possibility of war, the government increases its purchases of military equipment.
Increasing government purchases of military equipment would cause aggregate demand to (increase or +, decrease or -) I_ resulting in a(n) (inflationary or I, recessionary or R) I__ gap.
(Contractionary or C, Expansionary or E) C__ fiscal policy would help move the economy back to potential output by shifting the aggregate demand curve to the (right or R, left or L) L__.
d. The quantity of money in the economy declines and interest rates increase.
An increase in interest rates would cause aggregate demand to (increase or +, decrease or -) – _ resulting in a(n) (inflationary or I, recessionary or R) _R gap.
(Contractionary or C, Expansionary or E) E__ fiscal policy would help move the economy back to potential output by shifting the aggregate demand curve to the (right or R, left or L) R.
D. Show why a $100 increase in government purchases of goods and services will have a larger effect on real GDP than a $100 increase in government transfers or a $100 decrease in taxes by completing the accompanying table. The economy has a marginal propensity to consume (MPC) of 0.6. When answers aren’t whole dollars round each answer to two (2) decimal places (e.g., 51.6678 = 51.67) before summing in 18 – 20. All submitted answers should also be entered with two (2) decimal places. The table below shows what happens when either government spending (G) or transfer payments (TR) are increased by $100 or taxes (T) are decreased by $100. In the first round the increase in government spending (G) immediately increases GDP by $100 (since the government purchased goods and services). It also immediately increases disposable income (YD) by $100 since the government spending becomes income to someone. When transfer payments are increased by $100, or taxes (T) are decreased by the same amount GDP does not increase in the first round as no goods or services were purchased. All a change in transfer payments or taxes does in the first round is change disposable income (YD). In the second round, the same thing occurs in all three cases. Since YD increased by $100 in Round 1 consumption will increase by $60 in Round 2. This results because people will spend 60% of their change in income and save the other 40% (MPC = 0.6). This round GDP increases by the $60 that consumers spend on goods and services in all three cases. YD also increases by $60 as the money that consumers spend becomes income to someone else. In Round 3 consumers will spend 60% of the $60 increase in disposable income from Round 2 ($36). Fill in the table below for additional rounds. (Remember to round your answers to two decimal places.) Then sum the changes in GDP for the 10 rounds. Again, notice that fiscal policy only causes a change in GDP for a change in G in the first round. The same size change in TR or T does not cause a change in GDP in the first round. Also, note that after the first round all changes in GDP are the result of changes in C. You only need to total the Δ GDP columns. If you have any trouble with 18 – 22 please reread the above.
Δ G = $100
(MPC = 0.6)
Δ TR = $100
(MPC = 0.6)
Δ T = – $100
(MPC = 0.6)
Rounds Δ G (or C) Δ GDP Δ YD Δ TR (or C) Δ GDP Δ YD Δ T (or C) Δ GDP Δ YD
1 Δ G = $100 $100 $100 Δ TR = $100 $0 $100 Δ T = – $100 $0 $100
2 Δ C = $60 $60 $60 Δ C = $60 $60 $60 ΔC = $60 $60 $60
3 Δ C = $36 $36 $36 Δ C = $36 $36 $36 Δ C = $36 $36 $36
4
5
6
7
8
9
10
Total X X X X X X
When government purchases increase by $100, the sum of the changes in real GDP after the 10 rounds is $___248.51_____. This is the total of the 10 rounds.
When the government increases transfer by $100, the sum of the changes in real GDP after the 10 rounds is $__148.51______. This is the total of the 10 rounds.
When the government reduces taxes by $100, the sum of the changes in real GDP after the 10 rounds is $__148.51______. This is the total of the 10 rounds.
Using the formula for the multiplier for changes in government purchases, for changes in transfers, and for
changes in taxes calculate the total change in real GDP due to a $100 increase in government purchases, a
$100 increase in transfers, and a $100 decrease in taxes.
The spending multiplier is 2.5__. The transfer payment multiplier is 1.5____ and the
tax multiplier is -1.5__.
The change in GDP resulting from a $100 increase in government spending is $___250_____.
The change in GDP resulting from a $100 increase in transfer payments is $__150______. The
change in GDP resulting from a $100 decrease in taxes is $___150_____.
[Your answers in 22 should be close to your answers for 18 to 20. Using a multiplier saves one from
having to determine the results for many rounds and then summing.]
SECTION II A. In each of the following cases, either a recessionary or inflationary gap exists. Calculate the change in government purchases of goods and services, the change in government transfers, or the change in taxes necessary to close the gap. Use whole numbers (no decimals) as answers in this section. a. Real GDP equals $100 billion, potential output equals $160 billion, and the marginal propensity to consume is 0.75.
Government purchases must (increase or +, decrease or -) + by $__15____ billion to
close the (recessionary or R, inflationary or I) R__ gap, OR
Transfer payments must (increase or +, decrease or -) + by $___20_____ billion to close
the (recessionary or R, inflationary or I) R__ gap, OR
Taxes must (increase or +, decrease or -) – by $__20____ billion to close the
(recessionary or R, inflationary or I) R gap.
b. Real GDP equals $250 billion, potential output equals $200 billion, and the marginal propensity to consume
is 0.5.
Government purchases must (increase or +, decrease or -) – by $____25____ billion to
close the (recessionary or R, inflationary or I) I gap, OR
Transfer payments must (increase or +, decrease or -) – by $___50___ billion to close
the (recessionary or R, inflationary or I) I gap, OR
Taxes must (increase or +, decrease or -) + by $___50___ billion to close the
(recessionary or R, inflationary or I) I gap.
c. Real GDP equals $180 billion, potential output equals $100 billion, and the marginal propensity to consume
is 0.8.
Government purchases must (increase or +, decrease or -) – by $___16___ billion to
close the (recessionary or R, inflationary or I) I______ gap, OR
Transfer payments must (increase or +, decrease or -) – by $____20_ billion to close
the (recessionary or R, inflationary or I) __I gap, OR
Taxes must (increase or +, decrease or -) I__ by $___20_____ billion to close the
(recessionary or R, inflationary or I) __I gap.
B. Answer the following questions using whole numbers where possible and rounding to one decimal place when the answers are not whole numbers. If the budget balance is negative make sure you include a minus (-) sign.
Suppose the government spends $500 billion during the fiscal year on goods and services. In addition, the government collects tax revenues of $480 billion and makes transfer payments equal to $150 billion. Assume the economy is producing at the potential or full employment output level. The budget balance for this economy is equal to $_-170_______ billion and the government is running a (deficit or D, surplus or S) _D.
Suppose the national debt is $80 trillion and the government spends $800 billion during the fiscal year on goods and services. In addition, the government collects tax revenues of $600 billion and makes transfer payments equal to $300 billion. Assume the economy is producing at the potential or full employment output level. The budget balance for this economy is equal to $__-500______ billion and the national debt is $ -80.5_____ trillion. C. 12. Holding everything else constant, the government’s budget balance
a. tends to increase during a recession. b. tends to increase during an expansion. c. will increase if the government pursues the expansionary fiscal policy. d. Answers (a) and (c) are both correct. e. Answers (b) and (c) are both correct.
The debt-GDP ratio a. provides a measure of government debt as a percentage of GDP. b. provides a measure of government debt relative to the potential ability of the government to collect taxes to cover that debt. c. can fall, even if the level of government debt is rising, provided that GDP grows faster than the debt. d. Answers (a), (b), and (c) are all correct.
Implicit liabilities a. are not included in the calculation of the debt-GDP ratio in the United States. b. are promises made by the government that represents a debt that must be paid by the government at some future point in time. c. are usually included in debt statistics. d. Answers (a), (b), and (c) are all correct. e. Answers (a) and (b) are both correct.
Government transfers are payments from the government a. to households as compensation for taxes that the household has paid. b. to households for which no good or service is provided in return. c. that redistributes purchasing power from one group of households to another group of households. d. Answers (a) and (c) are both correct. e. Answers (b) and (c) are both correct.
Economists caution that a. recessionary gaps are so threatening that the government ought to be always ready to enact discretionary fiscal policy to counteract the recessionary gap. b. there are important time lags in the use of fiscal policy and that discretionary fiscal policy must be carefully employed if it is to result in less economic fluctuation rather than more economic fluctuation. c. recessionary gaps are often over before discretionary fiscal policy has any impact and, thus, the discretionary policy has no impact on the economy. d. the existence of lags makes the implementation of fiscal policy easier than it would be without the lags.
When a government runs a deficit persistently year after year, this may a. place financial pressure on future budgets. b. result in higher taxes over time since the government will need to collect tax revenue to cover its interest payments on the government debt. c. reduce the level of private investment spending as the government’s borrowing crowds out investment spending. d. Answers (a), (b), and (c) are all correct. e. Answers (a) and (b) are both correct.
Many economists think the largest economic issue facing the country is: a. the size of the budget deficit. b. the size of the national debt. c. the size of the nation’s implicit liabilities. d. the size of the nation’s debt-GDP ratio.
For CAPM Beta Taken individual beta for each stock and multiplied it with the weight of each stock in the portfolio. Sum up the product of each stock beta and its weight to get CAPM BETA
Total risk Calculate the variance and covariance matrix using covariance in the data analytics option. Perform Mmult function for the transpose of the weight matrix, covariance matrix and then gain with weight matrix without transpose. You will get the total risk of the portfolio.
Systematic risk Calculate the portfolio expected return then divide it by market return
Idiosyncratic risk Sum of the variance of all the stocks divided by the number of stock
R-square Calculate the correlation of each stock with the market and multiply it with the weight. Do summation of the square of the product.