Oligopoly is an imperfectly competitive market form, where there are few sellers and a large number of buyers, and the product may be homogeneous or differentiated. Since there are few sellers, so there arises Conscious Rivalry among the firms. That is, if a firm takes any action or strategy, then it influences the act or strategy of its rival firm. This mutual interdependence leads to strategic interactions between the firms.
When the firm’s strategies on their own without cooperating with its rival firms, or without any explicit or implicit agreement, then this leads to non-collusive oligopoly, producing ‘price wars’ among each other.
Case I: When the conjectural variation is zero, i.e., when a firm changes its price, it considers the price of the rival firm remains unchanged. Here, the firms’ objective is to maximize profit. The profit functions can be written in a duopoly case as,
Π1 = Π1(P1,P2) and Π2 = Π2(P1,P2)
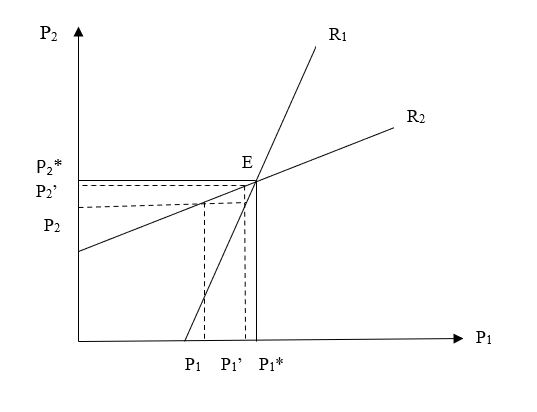
Suppose the first firm assumes P2 as constant and selects P1 in such a manner that its profit maximizes. In this way, we get different combinations of P1 and P2, which gives the price reaction curves of the firms R1 and R2.
If the first seller’s price is P1, then firm two assumes that firm one will maintain P1 price, and so to maximize its profit, he chooses P2. Again, corresponding to P2, the first seller fixes his price level at P1‘, to maximize his profit. In response to this, the second seller fixes his price at P2‘ and thus, we see that with the advent of time, the price level approaches the equilibrium value E at P1* and P2*.
Case II: When conjectural variation is non zero, there arises the problem of price leadership. Naturally, the leader gets some advantage, as it sophisticatedly incorporates its rival’s reaction function and accordingly maximizes his profit. In this process of becoming price leaders, both the firms end up earning lesser profit. Because each of them is stuck to the assumption that other’s behavior is governed by his reaction function, but in fact, neither of the reaction function is obeyed. As a result, both the sellers lose in this non-cooperative strategy, and a price war is inevitable.
The fact that the leader gains and the follower lose has the possibility that both the sellers will aspire to be leaders. If this happens, we get disequilibrium where both the sellers land into much worse positions. Considering the following pay-off matrix, the strategy ‘Leader’ is the dominant strategy for both the sellers, but as a result, they are worse off than the (Follower, Follower) strategy.
1st Sellers’ Strategy
2nd Seller’s Strategy
Leader
Follower
Leader
(2,2)
(10,1)
Follower
(1,10)
(5,5)
This act of price leadership, leading to a price war, ends when one of the firms surrenders and agrees to act as a follower, or a collusive agreement is reached with both the firms.
For more such insightful writings, feel free to connect with EduManta, which brings some young talents to guide you with the best of their knowledge and understandings in your concerned field. Visit: http://www.assignmenthelp.edumanta.com/ for assignment help and tutoring.
a) Provide practical examples of how long-term planning, specifically in health and education facilities, could support governments’ objective for better quality labour force. [K&U 4.1: 5 marks]
b) Examine and apply two economic theories related to development (based on the ones discussed during the course) to the performance experienced by a least developed country (or countries) of your choice over the years. [A&A 1.4: 7 marks]
c) Identify and explain five challenges encountered by Least Developed Countries (LDC) that hinder their progress to become developed nations. You are required to provide practical examples and include empirical data in your answers.
d) Develop a community-based-project that could be carried out by the government of Nigeria in order to improve the standard of living among locals in a particular community. You are requested to include practical examples as well as potential sources to finance such project. [A&A 4.2: 7 marks]
e) Propose solutions and actions that can be implemented by a country of your choice in specific areas to help the country pursue its development process.
[S&E 4.3: 10 marks]
f) Compile a list of resources (human and physical) that the country requires in order for the proposals mentioned in question (m) to be implemented. In your answer, you are expected to individually explain the role of each resource to facilitate the country to reach its overall economic development objectives.
A bottle makes and sells plastic bottles. It is observed that when the price is $42, only 12 bottles are sold in a week; but when the price decreases to $10, weekly sales rise to 25.
Assuming that demand can be modelled by a linear function,
(a) Obtain a formula for P in terms of Q;
(b) Sketch a graph of P against Q;
(c) Comment on the likely reliability of the model
Exercise 3: (14 Points)
A company sells packs of cell phone covers for $2. If a customer orders more than 100 packs, the company is prepared to reduce the unit price by 10 cents for each pack bought above 100 up to a maximum of 350 in a single order.
(a) How much does it cost to buy 140 packs?
(b) If the cost is $3524, how many packs are ordered?
Analyze the GDP growth of India in the last five financial years (2012-2017) and discuss how variation in growth had impacted your company’s business with reason and details.
Answer:
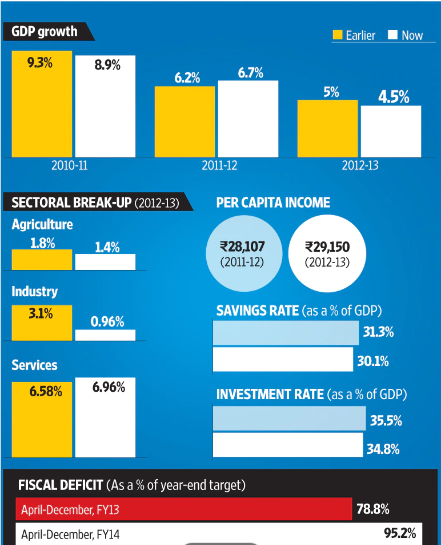
In 2011-12 fiscal year India’s economic growth was at 6.2 per. It had grown by 5.4%, 5.2%, 4.7% and 4.8% in the first, second, third and fourth quarter, respectively, of 2012-2013, according to data released by the central statistical organization. That makes it 5 percent for the entire 2012-2013 fiscal, after the revision of base year it fall to 4.5%. Major sectors affected were the manufacturing sector showing growth of 2.6% only, mining and quarrying by 3.1% farm sector output expanded by just 1.4% and farm sector also grew at a slower rate of just 1.9%.
The figure below shows the GDP for the year 2010-2013 along with the revised base year.
There are two contradictory influences operating in the economy this year. The investment was picking up, whereas consumption was decelerating. Unless investment grows at such a rate that is more than for falling consumption demand to make up for it, the net impact will be negative. The slowdown was mainly because of the laggard industry; weakness in the services sector was also evident. The Reserve Bank of India had to cut policy interest rates at all three policy reviews by 25 basis points. The absence of ease of trading in terms of securing government approval along with high borrowing cost has stalled corporate investment. At the same time, high inflation and slower hiring have shaken consumer confidence and forced households to cut spending. The decrease in the rates of savings of the household sector in physical assets from 15.8% to 14.8% and private corporate sector from 7.3% to 7.1% have attributed to a decrease in the rate of GDP in the current year compared to the previous year.
In 2013-14, smart farm sector growth contributed to India’s economy to grow 4.7 percent, according to the gross domestic product (GDP) provisional estimates which were 1.4% last year. The GDP growth rate of 4.5% in the previous was lowest in the last 10 years. This is the second back to back when the economy’s growth remained below 5 percent. The last time the economic growth rate had been below the 5-per cent mark was in 1984-85 to 1987-88.
Good harvests in both the seasons of 2013-2014 lifted farm sector growth to 4.7%. It had grown 1.4 percent in the previous fiscal. For January-March, the farm sector grew 6.3 percent against 1.6 percent growth in the same quarter of 2012-13 but because of low movement in infrastructure and high-interest rates kept investments or capital formation low.
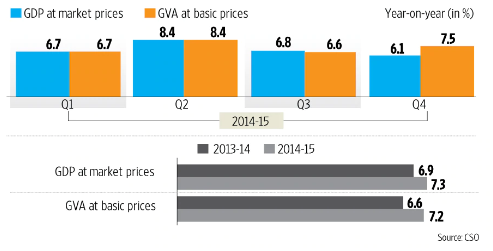
The below fissure shows GDP at market price and GVA at a basic price for the year 2014-2015
In 2014-15 the economy grew at 7.3 percent. The country outpaced China’s GDP of 7 percent in January—March quarter and posted a 7.5 percent growth in that quarter. Indian economy in 2014-2015 has emerged as one of the largest economies with strong economic outlook supported by controlled inflation, a rise in domestic demand, an increase in investment, a decline in oil prices and reforms among others.
Demand-side showing significant growth of final consumption which increased to 7.6% in 2014-2015 form 6.5% in 2013-2014, even the gross fixed capital formation increased from 3.0% in 2013-2014 to 4.1% in 2014-2015. Exports in 2014-2015 showed a growth of just 0.9% as compared to 7.3% in 2013-2014. Whereas, Imports, on the other hand, increased from -8.4% to -0.5%, due to a sharp decline in international oil prices bringing down the current year oil import bill.
Robust manufacturing growth in the year 2015-2016 makes India the fastest-growing major economy with a five-year high growth rate of 7.6 percent for the full fiscal. The farm sector also showed growth as against a contraction in the previous year, though the rate of expansion was low at 1.2 percent in 2015-16.
According to the data released by the Central Statistics Office (CSO), the growth in manufacturing and farm sectors during the January-march quarter went up to 9.3% and 2.3%, respectively. The trade, hotels, transport, and communication at 9.9%, the construction sector grew at 4.5%, financial, public administration, defense and other services at 6.4% and real estate and professional services at 9.1% in the fourth quarter of 2015-16. The manufacturing sector spurred to 9.3 percent, up from 5.5% in the last fiscal.
The growth rate of Indian Gross Domestic Product (GDP) increased from 6.6 percent in 2013-14 to 7.2 percent in 2014-15 and further to 7.6 percent in 2015-16, witnessing improvement in growth rate in the last three years. The implementation of strategic policy and systematic focus of the Government of India on economic growth and macroeconomic stability made India one of the fastest-growing major economies in the world. The Government has taken various initiatives and policy that strengthen the economy which include; reforms and liberalization of foreign direct investment in major sectors, fillip to manufacturing and infrastructure through fiscal incentives and concrete measures for transport, power, and other urban and rural infrastructure; measures to debottleneck the supply of key raw materials, etc.
The GDP grew 7.1% in the fiscal year 2016-17 because of economic growth slowed to 6.1% in the fourth quarter ending March 2017, compared with 7.1% in the previous quarter, as the government’s demonetization decision slowed activity in cash-dependent sectors.
In FY 17, the government’s final consumption expenditure was the major driver of GDP growth with an increase of over 23% as against 2.2 percent in FY 2016. The gross capital formation at GDP at constant prices, an indicator investment across the country, declined by 0.2% in FY17, continuing the downward trend since 2011. In FY 16, the export of goods and services witnessed a growth of 2,2% against y-o-y decline of 5.2% in FY15, owing to a partial recovery in commodity prices. The import witnessed a yo-y decline of 3.8% due to lower gold and other bullion imports.
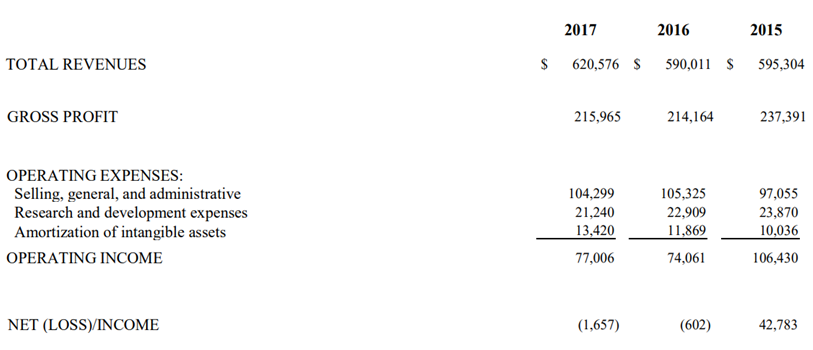
The figure below shows the last three-year excerpt from Profit and loss statement of Aricent.
The above-presented profit and loss statement of Aricent is not very rosy. Thought the top line seems to be increasing from 2016 to 2017 but the company bottom line is showing huge loss in the company books of accounts. The GDP and other economical statistic show robust growth in these years but the financial statement of Aricent is not reflecting the same.
A major part of Aricent’s revenue is still formed communication and network equipment service providers despite buying out SmartPlay, a 1200-persons chip design services outfit from Bangalore, in 2015. Aricent was an engineering services company, which was sharply focused on telecom—with its ups and downs. Moreover, growing a company with a lot of debt, then even when the business generates cash, a part of it has to be deployed to repay debt.
From the above analysis of GDP growth from 2015 to 2017 have been contributed to different factors. For instance, in 2015 the reason for higher growth is high agricultural produce rather than high growth in the manufacturing or service sector. In 2016 the major reason for the increase in growth rate was huge government spending and not the service sector. The service sector have shown moderate growth during this period and has failed to be resilient to slow down in service and exports. In 2017, there is a slowdown in growth rate which is primarily because of demonetization. The service and manufacturing sector, private investment and demand are not gearing up, though the government has come up with many policies to promote India on the international front. Government initiatives like Make in India, skill development programs are not enough to bring India to a growth trajectory.
Question:
To
what extent India’s GDP growth in alignment with the top line and bottom line
of your company?
Answer:
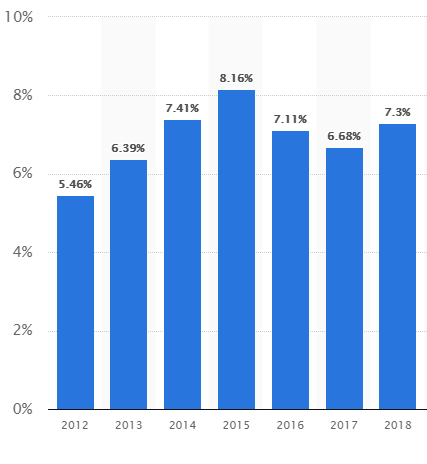
The figure below shows the GDP of India from 2012 to the 2018 fiscal year.
The GDP growth rate has a negative trajectory from the last 3 years and on positive lines from 2012 to 2015. Aricent top-line sales show the increase in growth but this growth is not reflected in the company bottom line as it is falling y-o-y as even went into the loss for the last 2 years. Aricent is a non-listed company and its major competitors like HCL, TCS, CSR, and Wipro all are listed and give hard competition to the company. In the time of weak demand and a highly competitive environment, Aricent is trying to capture the market on the basis of acquisition.
Further,
Aricent missed the IPO affect its client confident. Aricent is facing fund
restraint in expanding its footprint further in the country. If it would be
able to launch IPO, this would have a positive impact on the company’s
reputation and it would help the company to further reach the capital market
for funds to expand its business.
The company has done an acquisition of smart play in 2015 and consequently, the loan book of the company has increased considerably. This lead to an increase in the interest burden putting a lot of presser on the company’s financial statement. Apart from the interest burden, the company has losses on account of the exchange rate due to weakling rupees. The fall in GDP since 2015 on account of slow down on demand-side as well as poor performance of the service sector hits the company profit as well.
Do you sense any alignment between the Indian monetary policy and the US Central Bank policy? Substantiate the same.
Answer:
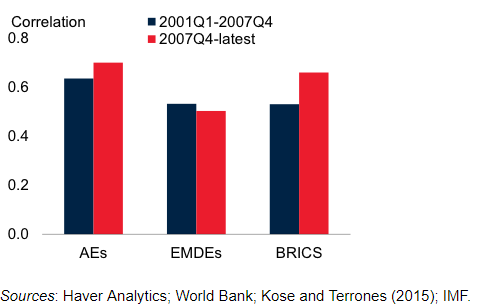
Monetary policy, especially in large industrial countries with open capital markets shapes global capital flows. Many such countries particularly following zero rate policy results in capital flows eventually finding homes in places like India, and emerging economies. Business cycles in the US, other advanced economies (AEs), and emerging market and developing economies (EMDEs) have been highly synchronous (Figure below). This shows the extent to which global trade and financial linkages of the US economy with the rest of the world at the same time these global shocks drive common cyclical fluctuations. Other countries tend to be in the same business cycle phase as the US roughly 80% of the time. Although it cannot and an easy task to establish empirically whether the US economy leads the business and financial cycle turning points in other economies, recent research shows that the US seems to influence the timing and duration of recessions in many major economies (Francis et al. 2015).
The figure below shows the correlation between the US and other economies of the world.
Monetary
policy, especially in large industrial countries with open capital markets
shapes global capital flows. Many such countries particularly following zero
rate policy results in capital flows eventually finding homes in places like
India, and emerging economies. Business cycles in the US, other advanced
economies (AEs), and emerging market and developing economies (EMDEs) have been
highly synchronous (Figure below). This shows the extent to which global trade
and financial linkages of the US economy with the rest of the world at the same
time these global shocks drive common cyclical fluctuations.
Other countries tend to be within the same variation section because of the US roughly eightieth of the time. Although it cannot and an easy task to establish empirically whether the US economy leads the business and financial cycle turning points in other economies, recent research shows that the US seems to influence the timing and duration of recessions in many major economies (Francis et al. 2015). The figure shows the high positive correlation of the US Business Cycle with other Economics in the world.
Since 2008, after the financial crisis, the US followed quantitative easing and zero-interest framework. This led investors from across the world to emerging countries like India for higher returns with higher risks. Institutional investors in the US and other developed economies deploy trillions of dollars in various financial instruments around the world. Such as the US as well as international equity markets, US along with other international bond markets, US and other countries’ government bonds, real estate, venture capital, commodities, and private equity, derivatives, etc. These institutional investors have some annual target rate of return which they need to achieve. For instance, a public pension fund may seek annual return of a three-to-four percent, five-to-eight percent may be targeted by an endowment, whereas a hedge fund might target 15 to 20 percent. Thus they start looking for higher returns outside their countries in the regime of zero rate policy thus increased return means increased risk.
Lower interest rate and quantitative easing lead to zero interest rate policy in the US after the 2008 crisis. This means that bonds and other financial instruments in the US were less attractive for short term investors. They will start looking for an option outside the US i.e. into other emerging economies like India where there is higher return with higher risk. This lead to huge inflow of FDI in India in 2014 and ahead. The country surpassed its earlier records in terms of FDI and even the stable government and its initiative make it an attractive destination for institutional investors.
Soon when the US was released that Zero rate policy helped them to make the economy stable, control deflation and reached desired inflation rate, unemployment went down than in 2013 amid form mounting uncertainty about global economic prospects, increasing oil prices, growing political and economic tensions in the euro area, and strong monetary policy responses the US hinted to increase it interest rate, though there’s been some fallout from these financial market developments, none has threatened financial stability. This triggered substantial amount of credit to flow into bond markets through mutual funds and ETFs; Some rise in dollar interest rates and the dollar exchange rate is to be expected as U.S. monetary policy firms; so higher interest and exchange rates are ways in which tighter policy is transmitted to the economy to restrain early inflation pressure.
But
an unexpectedly sharp rise in rates or increase in volatility could reveal
weaknesses and mismatches among borrowers that have not been anticipated by investors.
And the effects could be especially felt in emerging market economies like
India, which had been the recipient of so much of the flows seeking higher
yields.
Now From 2013, the Fed continues to implement quantitative tightening and the large issuance of government paper by the US Treasury as a result of the Trump administration’s fiscal policies. In response, RBI raised its repo rate by 25 basis points to 6.25 percent. The increased rate is a response not only to the risks to the inflation target that have emerged recently but also the risk of capital exiting emerging market economies. Institute of International Finance data shows that in May a combined US$12.3 billion of outflows in bonds and stocks in one month. With such a high scale of capital outflow, it’s easy to see why countries such as India and Indonesia, as well as others such as the Philippines and Turkey, have had to hike domestic rates recently.
Capital outflow from emerging economies, as data from Thomson Reuters, shows that capital is flowing to US-based money market funds which saw inflows of nearly US$34.9 billion from investors worldwide were drawn to the mixture of upper US yields and perceived lower risk.
In addition, higher interest rates in the US put pressure on emerging market economies to increase their interest rates to save and secure their investment inflows. The monetary tightening policy of RBI in response to a hike in interest rate by the US was inevitable. Thus RBI Hiked the policy rate by 25 basis points to 6.25%. This was the first hike by RBI since 2014. This hike in the policy rate will restrict some outflows and reduce the pressure on the INR to depreciate. Though the reduction in rates by RBI may reduce inflation in the Indian economy as money will become more expensive to borrow, this can also result in a slow economic activity and hinder investment activity.
Question:
Analyze
the impact of the Federal Reserve Bank rate on the Indian economy.
Answer:
Increase in interest rate by Fed, which means it will create pressure on RBI to increase its policy rate that could result in fewer jobs in India; a decrease in economic activity will lead to companies refraining from hiring new workers. Fed rate hike can have short-term implications on the Indian financial market, but RBI’s monetary policy tightening will not have a favorable effect on the Indian economy.
US is following quantitative easing and zero-interest framework from 2008 i.e. from the time of global financial crisis till 2014, after which the US Fed has raised its benchmark short-term interest rate for the seventh time, and the second time in 2018, by 25 basis points to a range of 1.75-2%. As the US economy seems to be stable and its objective well achieved—the inflation rate of 2.9% in May 2018 was higher than the targeted rate of 2% and a lowest unemployment rate of 3.8% in the last two decades. These recent hikes and further expected hikes will have major implications for India and emerging market economies as this will increase liability on dollar-denominated debt, capital flows, exchange rate appreciation, and inflation.
The hike is expected to be followed by other developed countries that have been following zero-rate policies such as Japan and other European countries. This will lead to a further outflow of funds which will weaken the INR against the US dollar, moreover, the increase in US government securities rates will put pressure on India and other emerging economies’ government bond yields. The equity investment will also route out from emerging economies towards the US market as the hike and better economic conditions in the US will boost the confidence of investors. The Reserve Bank of India (RBI) data shows, the sharp decline in net portfolio investment to India after the hike in March 2018. In fact, the net portfolio outflow is $3,133 million versus the net portfolio inflow of $1,159 million between March and April 2018.
Current account deficit—increased from 0.6% of GDP in FY2017 to 1.9% in FY2018 due to the slowdown of short-term capital inflows which will put pressure on INR. INR had been already depreciated around five-hitter since the last Fed’s hike in March. Weakling rupees will lower the rate of return which will make Indian equity less attractive for foreign investors.
A weaker rupee will increase the import bill and inflation. Thought Export can be promoted under these circumstances to counter the negative effect. But this may not be enough as we have large import bills when capered to our exports. India’s carries it trade majorly in the dollar, either a stronger dollar or a weaker rupee can help reduce India’s trade deficit.
Analyze the change in oil prices in the last one year and its impact on the Balance of payment of the country.
Answer:
Oil is one of the most major sources of energy which contribute 27.3% of global primary energy demand. Oil is a limited resource and will not last forever. In 2015, oil reserve to production ratio was at 50.7 which means if oil continued to produce at this rate, it would last about 51 years. Thus scientists are working hard to explore alternate sources of energy. Besides, those geoscientists are busy finding out new sources of oil and exploring unexplored reserves. Tight oil and shale oil are becoming techno-commercially to produce and market. In recent times, unconventional oil and gas resources significantly impacted the dynamics of global oil & gas trade. In fact, these unconventional oil resources have increased the supply of oil in the global market which resulted in a fall in global oil prices. Moreover, the OPEC liberalized its high price policy by cutting the production significantly against its prior policy of producing an artificial shortage of oil in the global market to increase the price. The graph below is showing how the high oil price in 2014 fell significantly at the end of 2014.
The figure below shows International Oil prices from Jan 2014 to Aug 2018
Lower oil prices shrank India’s oil import bill when the oil prices fall from $110 per barrel to less than $45 per barrel in January 2015. In December 2014, oil imports fell 29% to $9.9 billion from $13.9 billion as compared to the same month of 2013. At this time there was slower growth in gold imports, helped India to lower its import bill and narrow its trade deficit in the month.
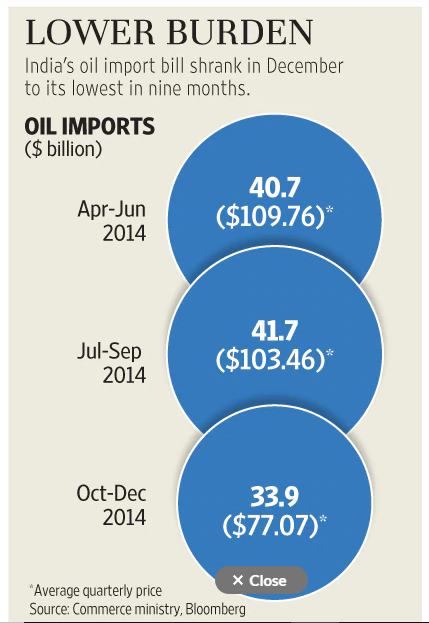
The fall in import bill in 9 months in by 4.78% to $33.9 billion, mainly because of lower oil imports, but on the other hand, exports dropped 3.77% to $25.3 billion. As the fall in imports was greater than the fall in export, it narrowed the trade deficit to $9.4 billion from $10.1 billion a year ago. The fall in oil prices will help the government to lower its subsidy burden as well as provide some relief to the external sector by keeping the current account deficit in check and hence ease pressure on the rupee. More correction in crude oil prices will improve India’s current account balance.
The figure bellows shows the shrank in import bill due to the fall in oil prices in 2014.
Recently the plummeting rupee and increasing fuel prices due to global factors set to weakling already weekend currency, widen current account deficit and affect its growth outlook. Rebounding oil prices after huge fall from 2014 in combination with India’s unrelenting demand for oil will push up oil imports and widen its current account deficit that measures the flow of goods, services, and investments. The increasing deficit will further weaken rupee, as more imports mean the country will need to buy more foreign currencies to meet its needs. This challenging global environment has made the Reserve Bank of India (RBI) intervene aggressively this year to contain rupee depreciation and also the drawdown in foreign reserves has been significant.
India’s is a country that heavily relies on imported oil and gas, the rising world oil prices have significantly inflated the oil import bill. Due to this India’s trade position deteriorating, with July’s trade deficit hitting a five year high. Oil prices have shot up this year, reaching $80 a barrel in May for the first time since 2014. The OPEC-led output cut, falling Venezuelan and Libyan output, as well as by an imminent drop in Iranian exports as U.S. sanctions return in November this year boosted the oil price to the highest. It is being speculated that the oil import bill in the fiscal year 2019 could spike above $114 billion. Oil imports were about $88 billion between 2017 and 2018 which is higher than the previous year’s cost of $70 billion.
India needs to bring its oil demand down that will lower the oil imports; this will help India to make growth more resilient. According to a report, India’s oil demand will increase to 4.4% annually in the next ten years, compared to 3.7 per year in the last 10 years. This rising oil imports can hit India’s gross domestic product badly in the long term.
Question:
Also, analyze its impact on your company.
Answer:
Altran
Technologies SA, a technology consultant main business areas are as follows:
Automotive industry – Due to continuous increase in oil prices and limited availability of oil resources the company is increasing the budget development of autonomous and connected vehicles and tackling the related safety and security issues; environmental issues (energy efficiency, electric vehicle) and development of so-called “green” mobility; and search for new mobility models.
Aeronautics – It has also increased its R&D in developing fuel-efficient aircraft and align its properties according to the Industry 4.0 norms.
Space, Defense, and Naval – This sector needs huge energy resources that are provided by oil and increasing oil prices to have a significant impact on its cost sheet.
Energy – In the oil and gas segment the increase in the price of the oil help them to increase their top line but this might now be a permanent solution as there is regular research going on developing alternative and unconventional energy resources such as sail oil etc.
Industry and electronics – n the electronics and semi-conductors segment, growth should be driven by the search for electronic components that are more rapid, miniaturized, mobile and low in energy consumption, on the one hand, and by the development of embedded systems, particularly for the automotive industry, and connectivity with the Internet of Things (IoT), on the other hand.
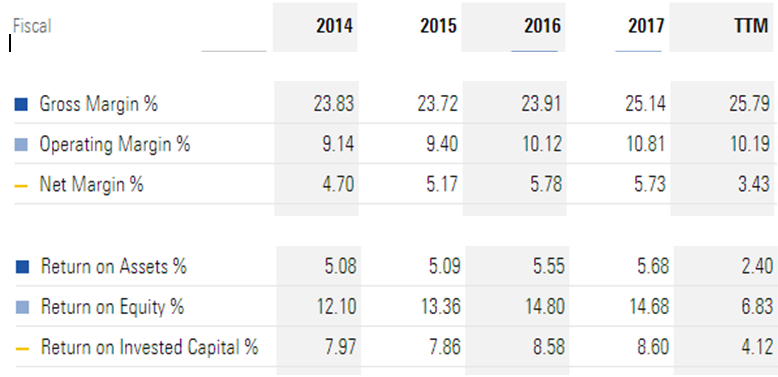
Thus we can see Altran Group has high exposure to oil and gas prices as its business is concerned. The effect of high oil prices can be seen in the basic financial ratios of the company given below.
The
figure below show profitability ratio of the company for last 5 year.
We can see hoe the Profitability ratio has gone up from 2014 to 2016, but it’s coming down henceforth. This is basically because the company was able to bring its operating expenses down when the oil prices were going down but after 2017 when oil prices started going up, it started hitting the profits of the company.
Oil prices can hit the company in two ways, in the automotive industry, for instance, the oil is a complimentary product to cars, the demand for which comes down as in the reign of high oil prices the consumers postpone their purchases. In can of the energy sector, the product itself is oil and an increase in the price may increase the revenue of the company but it can also drop the overall demand on the flip side. In a heavy industry where there is a high need for power for which oil can be the primary source of energy, oil being at a higher price will increase the cost to the company and that will pull down the profits of the company.
Technology – Processes a firm uses to turn
inputs into goods and services
Technology depends on – the skill of its managers, training of its workers, speed and efficiency of machinery/equipment
Technological change – a change in the
ability of a firm to produce a different level of output with a given quantity
of inputs
The input requirement set is the set of all input bundles required to produce at least a given level of output.
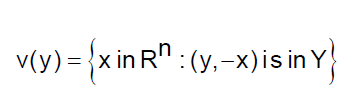
(y,-x) Net output bundle where –x is input
Y is a set of all technological production plan i.e. firm’s production possibility set.
V(y) Input requirement set.
Rn is a production plan
The isoquant gives all input bundles that produce exactly y units of output. In other words, an isoquant is the combination of all inputs that produce the same level of output i.e., y.
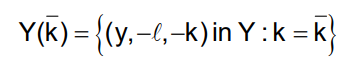
SHORT-RUN PRODUCTION POSSIBILITY SET
Y(K) is production possibly set when capital is fixed
Y is output
L is labor
K is capital
A production
function relates quantities of physical output of a production process to
quantities of physical inputs or refers to the technological relation between
physical inputs and outputs of the goods.
The production function for a firm which
has only one output can be defined as
With one combination of input (x), we can
get the maximum possible output (Y) then it is production function.
Transformation
Function
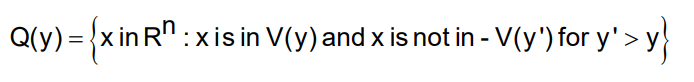
A production plan y in Y is technologically efficient if there is no y’ in Y such that y’ y and y’ y ; in other words, a production plan is efficient if there is no other way to produce more output with the same inputs or to produce the same output with fewer inputs.
The set of technologically efficient
production plans can be described by a transformation function:
The Cobb–Douglas production function is a particular functional form of the production function, widely used to represent the technological relationship between the amounts of two or more inputs (particularly physical capital and labor) and the amount of output that can be produced by those inputs. The Cobb–Douglas form was developed and tested against statistical evidence by Charles Cobb and Paul Douglas from 1927–1947.
Y = total production (the real value of all goods produced in a year or 365.25 days)
L = labor input (the total number of person-hours worked in a year or 365.25 days)
K = capital input (the real value of all machinery, equipment, and buildings)
α and β are the output elasticity’s of capital and labor, respectively. These values are constants determined by available technology.
Sometimes the term has a more restricted
meaning, requiring that the function display constant returns
to scale, meaning that doubling the usage of capital K and labor L will also
double output Y. This holds if
α + β =
1,
If
α + β <
1, returns to scale are
decreasing,
and if
α + β >
1, returns to scale are
increasing.
In economics, the Leontief production function or fixed proportions production
function is a production function that implies the factors of production will
be used in fixed (technologically pre-determined) proportions, as there is no
substitutability between factors. It was named after Wassily Leontief and represents
a limiting case of the constant elasticity of substitution production function.
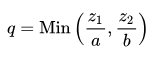
For the simple case of a good that is
produced with two inputs, the function is of the form
where q is the quantity of output produced,
z1 and z2 are the utilized quantities of input 1 and input 2 respectively, and
a and b are technologically determined constants.
ACTIVITY
ANALYSIS
The most straightforward way of describing
production sets or input requirement sets is simply to list the feasible
production plans.
The same Output can be produced using inputs 1 and 2, where it is possible by two technology (i.e. Combination of input) Tech 1, one unit of factor 1, 2 unit of factor 2. Tech 2, 2 unit of factor 1 and 1 unit of factor 2)
The marginal
rate of technical substitution (MRTS) is the rate at which one factor must
decrease so that the same level of productivity can be maintained when another
factor is increased. The MRTS reflects the give-and-take between factors, such
as capital and labor that allow a firm to maintain a constant output. MRTS
differs from the marginal rate of substitution (MRS) because MRTS is focused on
producer equilibrium and MRS is focused on consumer equilibrium.