Oligopoly Market

Price War in Oligopoly Market

Oligopoly is an imperfectly competitive market form, where there are few sellers and a large number of buyers, and the product may be homogeneous or differentiated. Since there are few sellers, so there arises Conscious Rivalry among the firms. That is, if a firm takes any action or strategy, then it influences the act or strategy of its rival firm. This mutual interdependence leads to strategic interactions between the firms.

     When the firm’s strategies on their own without cooperating with its rival firms, or without any explicit or implicit agreement, then this leads to non-collusive oligopoly, producing ‘price wars’ among each other.

Case I: When the conjectural variation is zero, i.e., when a firm changes its price, it considers the price of the rival firm remains unchanged. Here, the firms’ objective is to maximize profit. The profit functions can be written in a duopoly case as,

                 Π1 = Π1(P1,P2)  and Π2 = Π2(P1,P2

Suppose the first firm assumes P2 as constant and selects P1 in such a manner that its profit maximizes. In this way, we get different combinations of P1 and P2, which gives the price reaction curves of the firms R1 and R2.

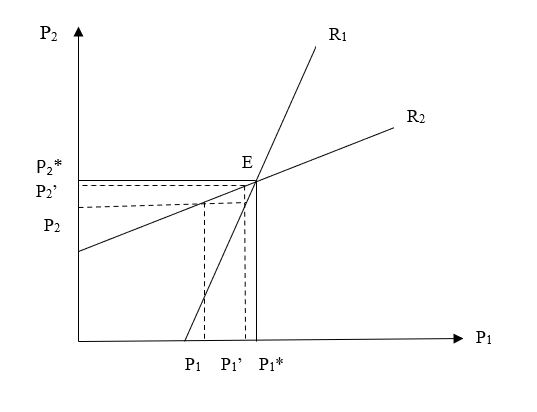
If the first seller’s price is P1, then firm two assumes that firm one will maintain P1 price, and so to maximize its profit, he chooses P2. Again, corresponding to P2, the first seller fixes his price level at P1‘, to maximize his profit. In response to this, the second seller fixes his price at P2‘ and thus, we see that with the advent of time, the price level approaches the equilibrium value E at P1* and P2*.

Case II: When conjectural variation is non zero, there arises the problem of price leadership. Naturally, the leader gets some advantage, as it sophisticatedly incorporates its rival’s reaction function and accordingly maximizes his profit. In this process of becoming price leaders, both the firms end up earning lesser profit. Because each of them is stuck to the assumption that other’s behavior is governed by his reaction function, but in fact, neither of the reaction function is obeyed. As a result, both the sellers lose in this non-cooperative strategy, and a price war is inevitable. 

        The fact that the leader gains and the follower lose has the possibility that both the sellers will aspire to be leaders. If this happens, we get disequilibrium where both the sellers land into much worse positions. Considering the following pay-off matrix, the strategy ‘Leader’ is the dominant strategy for both the sellers, but as a result, they are worse off than the (Follower, Follower) strategy.

1st Sellers’ Strategy2nd Seller’s Strategy
LeaderFollower
Leader(2,2)(10,1)
Follower(1,10)(5,5)

This act of price leadership, leading to a price war, ends when one of the firms surrenders and agrees to act as a follower, or a collusive agreement is reached with both the firms.

For more such insightful writings, feel free to connect with EduManta, which brings some young talents to guide you with the best of their knowledge and understandings in your concerned field. Visit: http://www.assignmenthelp.edumanta.com/ for assignment help and tutoring.

Advanced Studies in Econometrics

ECON 8820: Advanced Studies in Econometrics

You may work in groups on the assignment, but you must write up your own answers in your own words.
See the course profile for information on the due date of this assignment and penalties for late submission.

  1. Suppose that U is uniformly distributed on [0, 1] and X is continuously distributed as some distribution
    FX(·). Show that Y := F
    −1
    X (U) is also distributed as FX(·). (Or, X ∼ Y , i.e., X and Y are

distributionally equivalent.)
(Answer) You may start from the definition of the CDF. Here is an alternative method that uses the
change of variables. Let g(U) := F
−1
X (U). Then, g
−1
(Y ) = FX(Y ) and ∂g−1
(y)
∂y = fX(y). So,

fY (y) = 1(FX(y) ∈ [0, 1]) · fX(y)

on y ∈ Y, which is the support of X

  1. The dataset D in the matlab data file dataHW2.mat contains information on T = 50 markets, each with
    J = 5 differentiated products. The first column indicates each market t = 1, . . . , T, the second column
    indicates each product j = 1, . . . , J. The third column shows market share Sjt for all (j, t). The fourth
    to seventh columns are observed characteristics xj = [1, xj1, xj2, xj3], which vary across products but
    not across markets. The eighth is the price pjt. The other columns, say zjt, collect all the variables,
    including xj , that are correlated with the price but not correlated with unobserved characteristics ξjt.
    1

Consumer i’s utility of purchasing product j in market t is represented as

uijt = x
0
jβit + αitpjt + ξjt + εijt

and we assume that consumer i chooses one (and only one) product (including the outside option that
gives utility ui0t = εi0t) that gives the largest utility in market t. Assume that {εijt} are i.i.d with the
type I extreme value distribution so that the probability of consumer i of choosing j is

Pijt =

exp(x
0
jβit + αitpjt + ξjt)
1 + PJ
̃j=1 exp(x
0
̃j
βit + αitp ̃jt + ξ ̃jt)

where pjt and ξjt are potentially correlated, but the dataset does not have ξjt. Assume that

βit
αit
iid∼ N (μ, Σ)

across all i and t where μ is a 5 dimensional vector and Σ is a 5 ×5 symmetric positive definite matrix.
Using the BLP method, estimate the structural parameter θ := {μ, Σ}.
For this exercise:
• Report optimal GMM estimates for every element in μ and Σ.
• You do not need to report standard errors, but discuss in detail how you would compute them.
• Use a tight tolerance, e.g., 1e-13, for the inner loop (fixed point), and use a sufficiently large
number of iterations for the outer loop (evaluation of the GMM objective function)
• Employ 1,000 draws for the simulation of the random coefficients (β
0

it, αit), using the same ran-
domness for every iteration of the outer loop.

• Comment your codes in detail.
• Submit your codes.

Brookings Institute

Assignment 4 – Brookings Institute

You are an analyst at the Brookings Institution, a non-profit, non-partisan think tank that conducts public policy research and provides policy recommendations to governments. The Institution has several divisions, each focusing on different areas of economic and social policy, and each division produces a series of policy briefs (one per quarter) https://wagner.nyu.edu/files/faculty/publications/lightRumsfeldsRevolution.pdf. You are part of the division that focuses on (choose from list topic areas, below) and your boss has asked each member of your team to suggest one topic for next quarter’s policy brief. You will have two minutes to present your idea at a staff meeting [note that for most people, it would take about two minutes to read aloud 400 words]. Your assignment is only to suggest a general topic, not to write the full brief. That is, the primary objective of your presentation is to give the rest of the staff an idea of why this topic warrants further research for the full brief. It is typical to have at least one chart, diagram or graph on the front page of each policy brief so to help explain your topic, you should collect the relevant data and create a graphic that can be presented at the meeting.

Additional instructions: Go to the website for the Statistical Abstract of the United States to find your data (http://www.census.gov/library/publications/2011/compendia/statab/131ed.html). Use the raw data to prepare a graph or chart (not a table). Your chart should be labeled and titled appropriately; that is, identify variables, units of measurement or time, etc. The chart should be integrated into your presentation (i.e., incorporate discussion of the data with reference to the chart, don’t just tack on the chart at the end); however, graphics should always be able to stand alone as well so be sure that you have a title that is sufficiently descriptive. Although this is an oral presentation, you will need to submit the written text of your presentation (along with the graphic). The text should address the Who-What-Where-When-Why-How issues.

If the Statistical Abstract does not provide data appropriate for your topic, you may need to choose a different topic. You must submit your basic topic for approval prior to writing the brief.

Topic areas:

Education

Environment

Health

Income and poverty

Foreign commerce

Labor force

Law and security

Population/Demography

Social insurance and health services

Evaluation criteria

I will focus on the following specific areas when grading:

  1. Argument. Have you clearly and objectively made a good case for further investigation of this topic?
  2. Graphic. Is the graphic clear, appropriate and self-sufficient? Is it well-integrated with the text?
  3. Voice. Is the tone and style appropriate for this audience? Is jargon appropriate and explained as necessary?
  4. Overall clarity. Are ideas clearly expressed? Any problems with basic writing (spelling, grammar, punctuation) should be fixed before grading (more than two or three typos and your paper will be returned without a grade). I will be evaluating the readability, clarity, and style of the paper overall.

Writing for Money

Assignment 5 – Writing for Money

You would like to earn an additional amount of income for yourself to supplement income from your primary job. You have decided to become an economic journalist. Having read about how to gather data and having read some of the best business writing out there, you are going to try to craft a publishable article. You will need to brainstorm a topic, do research, and write an engaging and enjoyable piece of business/economic journalism.  Refer to your previous writings as guides to excellence. Also, feel free to see what is out there that inspires you.  Your word requirement for this assignment is between 1000 and 3000 words. Your assignment will be evaluated on how engaging your topic and writing are.  Strong command of grammar and the English language are expected.  This assignment will count as your final writing assignment. 

Economics

To submit,

  1. A copy (file or picture) of the original essay your picked from publications.

The grading will be based upon both numerical analysis and explanation.

Guide for research

Below are some suggested candidates for research topics.

  1. Planning for retirement savings
  2. How much should you earn to justify the cost of your college education?
  3. How much is the value of attending the graduate school?
  4. Project planning
  5. For other topics, please contact the instructor.

Please note that these are open questions. You need to determine your financial needs, the time line, the financial parameters, and how you can achieve your financial goal.  

I have included some useful financial sources.

Development Economics

a) Provide practical examples of how long-term planning, specifically in health and
education facilities, could support governments’ objective for better quality labour
force. [K&U 4.1: 5 marks]

b) Examine and apply two economic theories related to development (based on the
ones discussed during the course) to the performance experienced by a least
developed country (or countries) of your choice over the years. [A&A 1.4: 7 marks]

c) Identify and explain five challenges encountered by Least Developed Countries
(LDC) that hinder their progress to become developed nations. You are required
to provide practical examples and include empirical data in your answers.

d) Develop a community-based-project that could be carried out by the government
of Nigeria in order to improve the standard of living among locals in a particular
community. You are requested to include practical examples as well as potential
sources to finance such project. [A&A 4.2: 7 marks]

e) Propose solutions and actions that can be implemented by a country of your choice
in specific areas to help the country pursue its development process.

[S&E 4.3: 10 marks]

f) Compile a list of resources (human and physical) that the country requires in order
for the proposals mentioned in question (m) to be implemented. In your answer,
you are expected to individually explain the role of each resource to facilitate the
country to reach its overall economic development objectives.